Fig. 1.
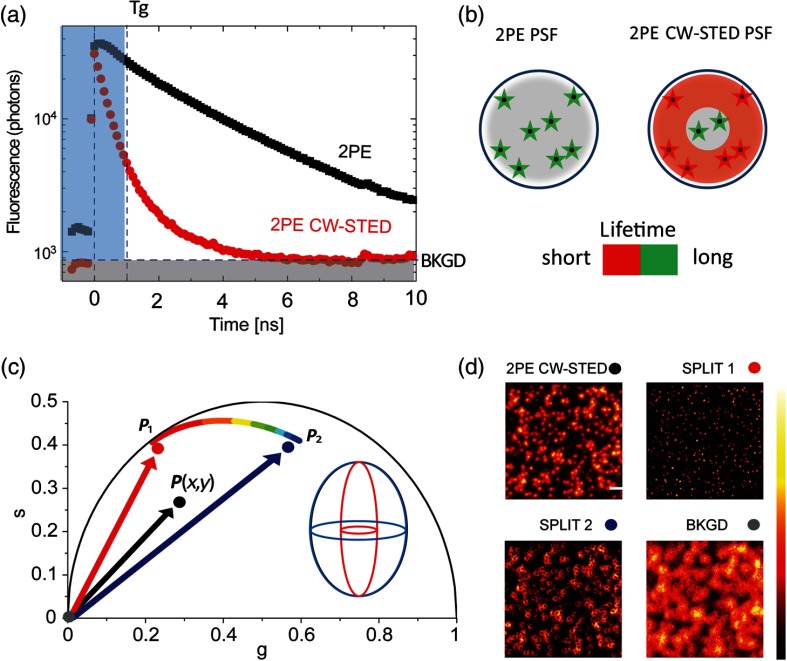
Principle of 2PE CW-STED SPLIT microscopy. (a) Temporal information demonstrating the fluorescence lifetime of a fluorescent sample following excitation by means of 2PE or 2PE CW-STED. Early photons (blue) and background (BKGD) (gray) are usually discarded. (b) Schematic representation of the spatial distribution of fluorescence lifetimes in the 2PE PSF (left) and in the 2PE CW-STED PSF (right). (c) Principle of the SPLIT illustrated using a phasor plot. Photons are separated based on their dynamics, represented as vectors in the phasor plot. The experimental phasor , describing the temporal information of the signal at each pixel, is used to obtain the final image. The first component (red) corresponds to the center of the PSF and contains super-resolution information, whereas the second component (blue) corresponds to the PSF periphery. The background signal is located at the origin. (d) Representation of the SPLIT approach. The images of SPLIT, respectively, represent raw 2PE CW-STED image (super-resolution information + early photons + background signal), SPLIT 1 (super-resolution information), SPLIT 2 (information discarded), and background. Color dots correspond to the definitions mentioned in panel (c).

