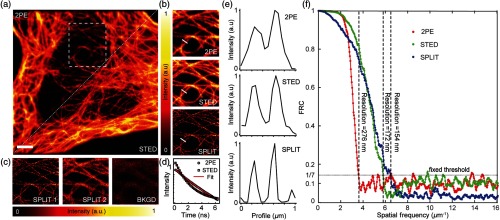
Fig. 2.
Comparison between 2PE and 2PE CW-STED imaging of microtubules in a fixed HeLa cell. (a) Basal membrane imaged with 2PE (left-top corner) and 2PE CW-STED (right-bottom corner) microscopy. (b) Magnified views of the boxed area in (a) with respective intensity profiles corresponding to the white bars. (c) Images corresponding to the PSF center (SPLIT 1), PSF periphery (SPLIT 2), and uncorrelated background (BKGD) obtained by application of the SPLIT algorithm. (d) Average fluorescence intensity decay for the 2PE and 2PE-STED data. The solid lines are fit of the data to Eq. (4) (2PE, , ; 2PE-STED, , ). (e) Intensity profiles along the dashed line in (e). (f) FRC of 2PE, 2PE CW-STED, and 2PE CW-STED SPLIT images in (a). This method is based on the acquisition of two independent images. These were obtained by sorting photons according to their arrival times. , , , . Laser powers were measured in the back focal plane of the objective lens. Scale bars: .

