Figure 4.
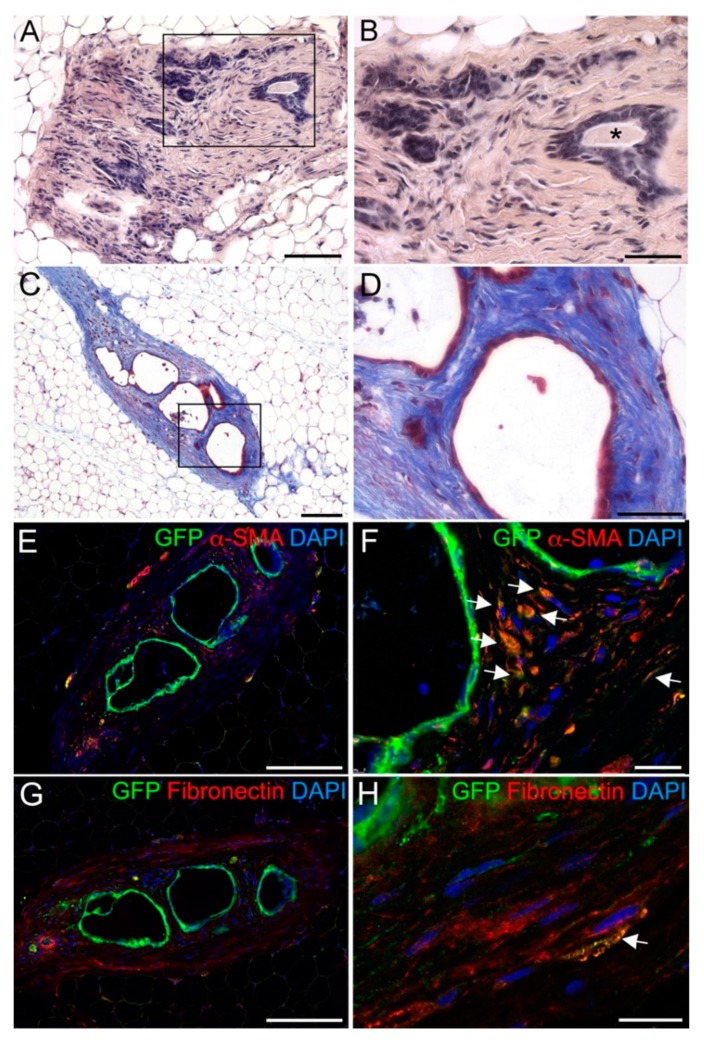
DESCs integrate in epithelial rudiments and potentially surrounding stroma. (A,B) Hematoxylin-eosin staining showing the formation of dense fibrotic tissue upon transplantation of DESCs. Black rectangular box in A indicates the region shown in B. Notice the presence of secretions within the ducts (asterisk in B). (C,D) Masson’s trichrome staining showing the composition of the fibrotic tissue surrounding the ducts. Black rectangular box in C indicates the region shown in D. (E,F) Double immunofluorescent staining against GFP and αSMA. White arrowheads indicate some of the double GFP+/α-SMA+ cells. (G,H) Double immunofluorescent staining against GFP and Fibronectin. White arrowheads indicate double GFP+/Fibronectin+ cells. Scale bars: 100 μm (B); 200 μm (A,C,E,G); 20 μm (F,H).

