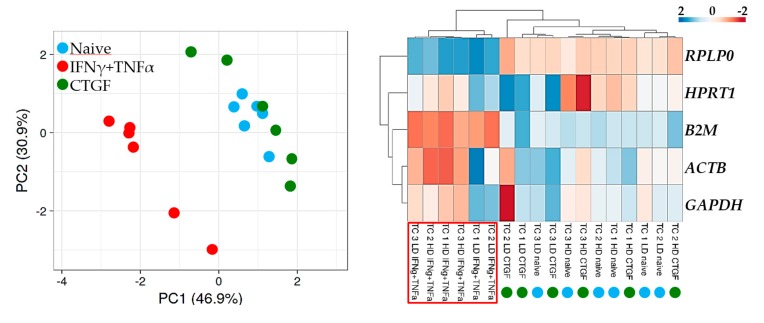
Figure 3.
Principal component analysis (PCA) and heat map of RG expression values. In PCA, the X- and Y-axis show principal component 1 and principal component 2 that explain 46.9% and 30.9% of the total variance, respectively. In the heatmap, positive values mean higher Cts, and negative values mean lower Cts with respect to mean values after row centering for each RG, indicating lower (high CTs) or higher (low Cts) basal expression, respectively. Both rows and columns were clustered using correlation distance and average linkage.

