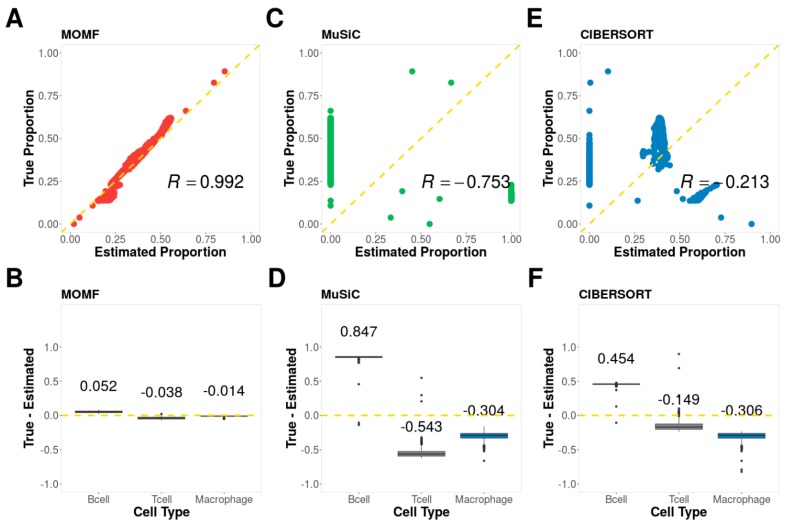
Figure 2.
Simulation results. The simulated data based three cell types, B cells, T cells, and Macrophage cells. (A) The scatter plot of ground truth and cell type proportion estimated by MOMF; (B) The boxplot to show the difference between ground truth and cell type proportion estimated by MOMF (C) The scatter plot of ground truth and cell type proportion estimated by MuSiC; (D) The boxplot to show the difference between ground truth and cell type proportion estimated by MuSiC (E) The scatter plot of ground truth and cell type proportion estimated by CIBERSORT; (F) The boxplot to show the difference between ground truth and cell type proportion estimated by CIBERSORT. R: Pearson correlation.

