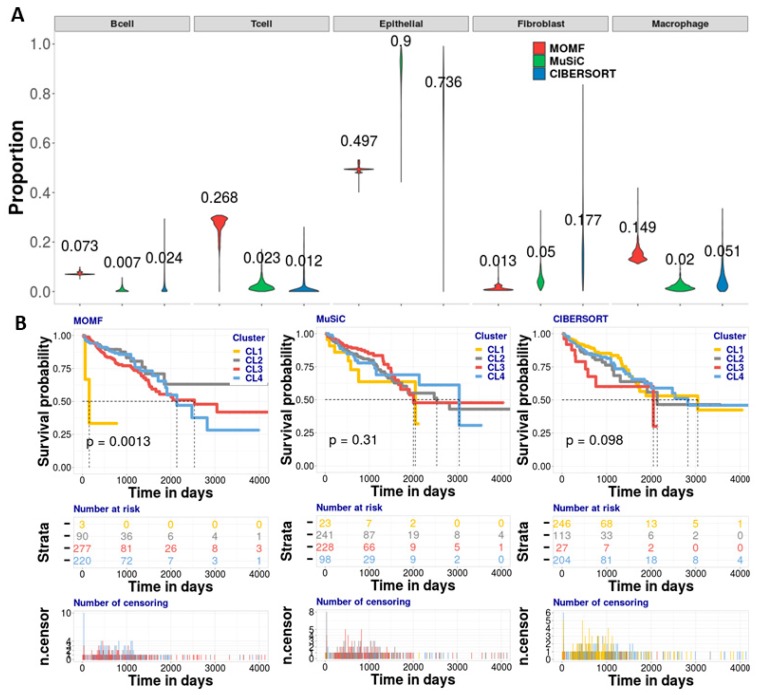
Figure 4.
Analyzing CRC bulk RNA-seq data with colorectal cancer scRNA-seq data. (A) The violin plot is to show the effect proportion of each cell type from three different methods. We found that the epithelial, T and macrophage cells are enriched by MOMF, which means that the two cell types potentially contribute to the survival of CRC. (B) The KM plots are used to show the survival analysis for four clusters from the TCGA bulk data. We used log-rank test to compare the distributions of four clusters. MOMF grouped the CRC samples into four subtypes (p-value = 0.0013). The cluster CL1 shows the poor-prognosis. Number at risk in the table shows the number of survival individuals at each 1,000 days. Number of censoring in the table shows censoring time of each individual. The numbers labeled in different colors in the two tables indicate the different subtypes.

