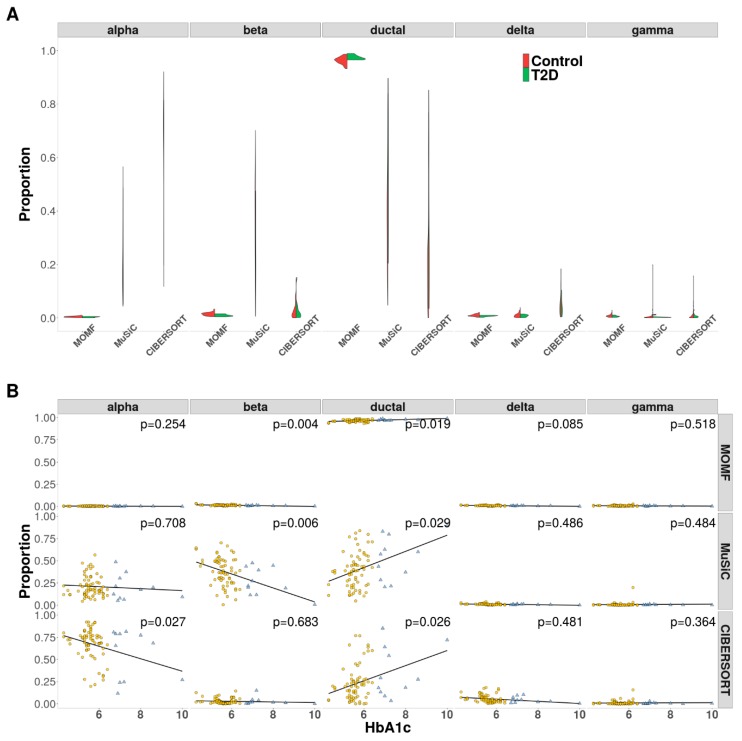
Figure 5.
AnalyzingT2D bulk RNA-seq data with pancreatic scRNA-seq data. (A) The violin plot is to show the effect proportion of each cell type from three different methods. beta and ductal cells are enriched from MOMF, which means that the two cell types potentially contribute to the survival of CRC. (B) The scatter plots are used to show the results of the associations between Hb1Ac level and cell proportion as adjust the covariates. The estimated beta cell proportions by both MOMF and MuSiC are strongly associated with Hb1Ac (p-value = 0.004 and 0.006).

