Figure 1.
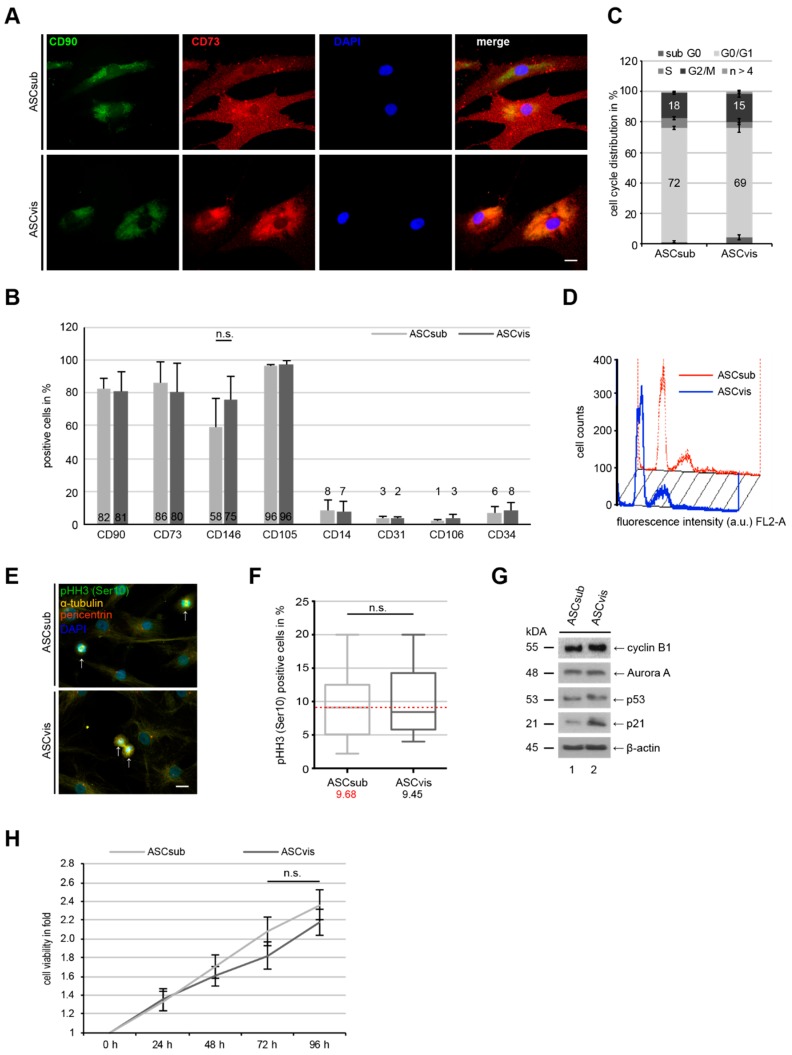
Subcutaneous and visceral adipose-derived mesenchymal stem cells (ASCs) display comparable cell surface marker profiles, cell cycle distribution and cell proliferation. (A) Immunofluorescence staining of mesenchymal stem cell surface markers CD90 (green) and CD73 (red), and DNA (DAPI, blue) in subcutaneous ASCs (ASCsub) and visceral ASCs (ASCvis). Scale: 20 μm. (B) Flow cytometric analyses of positive cell surface markers CD90, CD73, CD146, and CD105, and negative markers CD14, CD31, CD106, and CD34 for mesenchymal stem cells (MSCs). Values represent the percentages of ASCs expressing the indicated protein. The results from eight independent experiments (donors) are presented as mean ± standard error of the mean (SEM). (C,D) Cell cycle distribution was analyzed using a FACSCaliburTM. Profile examples were shown (C). Cell cycle phases of ASCs were presented in percentage and the results were derived from four independent experiments (D). (E,F) ASCs were stained for pHH3 (S10) (green), α-tubulin (yellow), pericentrin (red) and DNA (blue), and representatives are shown (E). Scale: 10 μm. pHH3 positive cells were quantified in ASCsub and ASCvis (F). The results are from three independent experiments with ASCs from three different donors and presented as median ± min/max whiskers in box plots. n.s. > 0.05. (G) Cellular extracts from ASCs were prepared for Western blot analyses with indicated antibodies. β-actin served as loading control. (H) ASCs were seeded in 96-well plates for 0, 24, 48, 72, and 96 h. Cell viability was measured via CellTiter-Blue® assay. The results are presented as mean ± SEM and statistically analyzed, showing no significant difference (n.s.).

