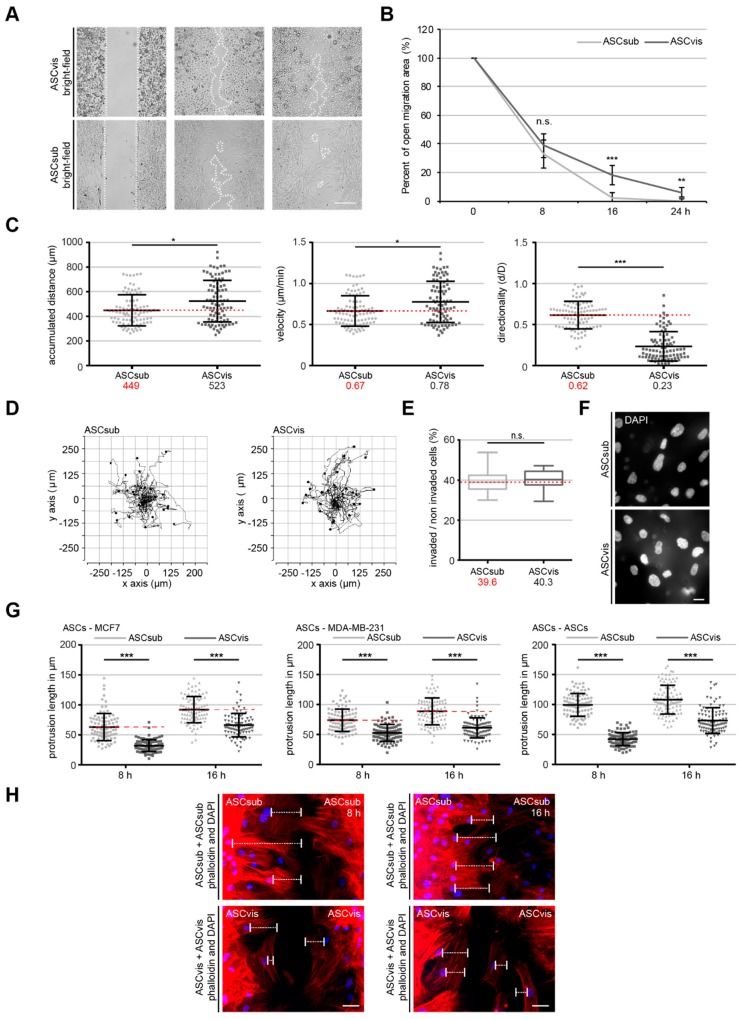
Figure 2.
Both ASC subtypes display a comparable motility rate, but subcutaneous ASCs have a significantly higher directed migration capacity. (A,B) Wound healing/migration assays were performed with subcutaneous and visceral ASCs, and images were taken at indicated time points (0, 8, 16, 24 h) to document the migration front. (A) Representatives are shown. White dashed line depicts the migration front. Scale: 300 μm. (B) Quantification of the open area between both migration fronts at various time points. The cell-free area at 0 h was assigned as 100%. The results from three independent experiments are presented as mean ± SEM. *** p < 0.001. (C,D) Time-lapse microscopy was performed with subcutaneous or visceral ASCs for up to 12 h. Random motility of these cells was analyzed. (D) Representative trajectories of individual cells (n = 30) are shown. (C) Evaluated accumulated distance (left), velocity (middle), and directionality (right) from three independent experiments are shown as box plots with variations. Unpaired Mann–Whitney U-test, * p < 0.05, *** p< 0.001. (E,F) Invasion assay. ASCs were seeded into transwells and starved for 12 h. The cells were released into fresh medium for 24 h and fixed for quantification. (E) Quantification of invaded cells per field in percent. The results from three independent experiments are presented as mean ± SEM. Student’s t test was performed showing no significant difference (n.s. > 0.05). (F) Representatives of invaded ASCs are shown. Scale: 25 μm. (G,H) Homing assays. ASCs and breast cancer cells were seeded in separated chambers of a culture insert and cultured for 0, 8 and 15 h. (G) Evaluation of cell homing distance, the length between the nucleus and the outermost cell protrusion, in subcutaneous and visceral ASCs toward MCF-7 cells (left), MDA-MB-231 cells (middle), and ASC themselves (right). Each experiment was performed in triplicate, and the results are based on three independent experiments and presented as scatter plot showing mean ± SEM. (red dashed line indicates median value of ASCsub). ** p < 0.01, *** p < 0.001. (H) Representatives of ASCs on both migration fronts stained against phalloidin (red) and DAPI (blue) are depicted. White bars indicate cellular protrusion length. Scale: 50 μm.

