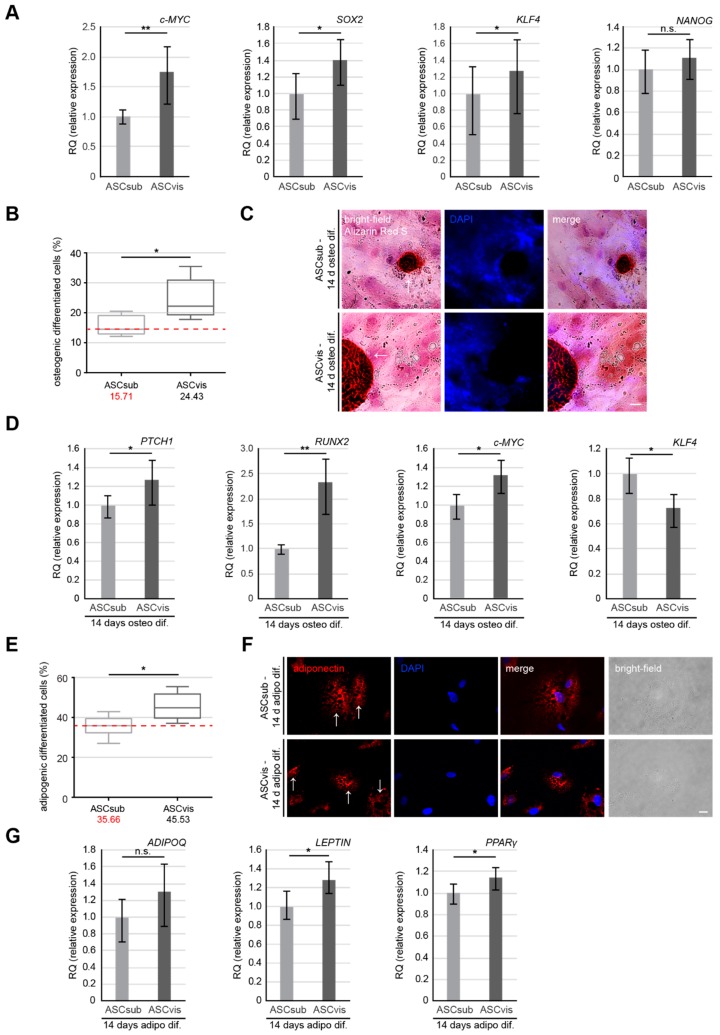
Figure 5.
Visceral ASCs are superior in osteogenic and adipogenic differentiation compared to subcutaneous ASCs. (A) Gene levels of stemness/self-renewal associated genes c-MYC, SOX2, KLF4, and NANOG are shown for subcutaneous and visceral ASCs. The results are from three experiments, presented as RQ with minimum and maximum range. Student’s t test, ∗ p < 0.05, ** p < 0.01. (B–D) ASCsub and ASCvis cells were induced into osteogenic differentiation for up to 14 days. The percentage of differentiated ASCs was evaluated by Alizarin Red S staining. (B) The quantification data are presented as median ± min/max whiskers (red dashed line indicates median value of ASCsub, n = 300 cells for each condition, pooled from three experiments). Student’s t test, ∗p < 0.05. (C) Example images for Alizarin Red S staining are shown. Scale: 20 μm. (D) Expression levels of differentiation related genes PTCH1 (1st graph), RUNX2 (2nd graph), KLF4 (3rd graph), and c-MYC (4th graph) in differentiated subcutaneous and visceral ASCs. The results are from three experiments and presented as RQ with minimum and maximum range. Student’s t test, ∗ p < 0.05, ** p < 0.01. (E–G) Analyses of cells with lipid vacuoles after 14 days of adipogenic differentiation. (E) The quantification shows the percentage of cells differentiated into adipogenic-like cells. Results are presented as median ± min/max whiskers in visceral ASCs (n = 200 cells for each condition, pooled from three experiments) and the red dashed line illustrates the median value of ASCsub. Student’s t test, ∗ p < 0.05. (F) Representative images of cells displaying lipid vacuoles stained for adiponectin (red) and DNA (DAPI, blue). (G) Gene levels of ADIPOQ, LEPTIN, and PPARγ after adipogenic differentiation are shown for subcutaneous and visceral ASCs. The results are from three experiments, presented as RQ with minimum and maximum range. Student’s t test, ∗ p < 0.05.

