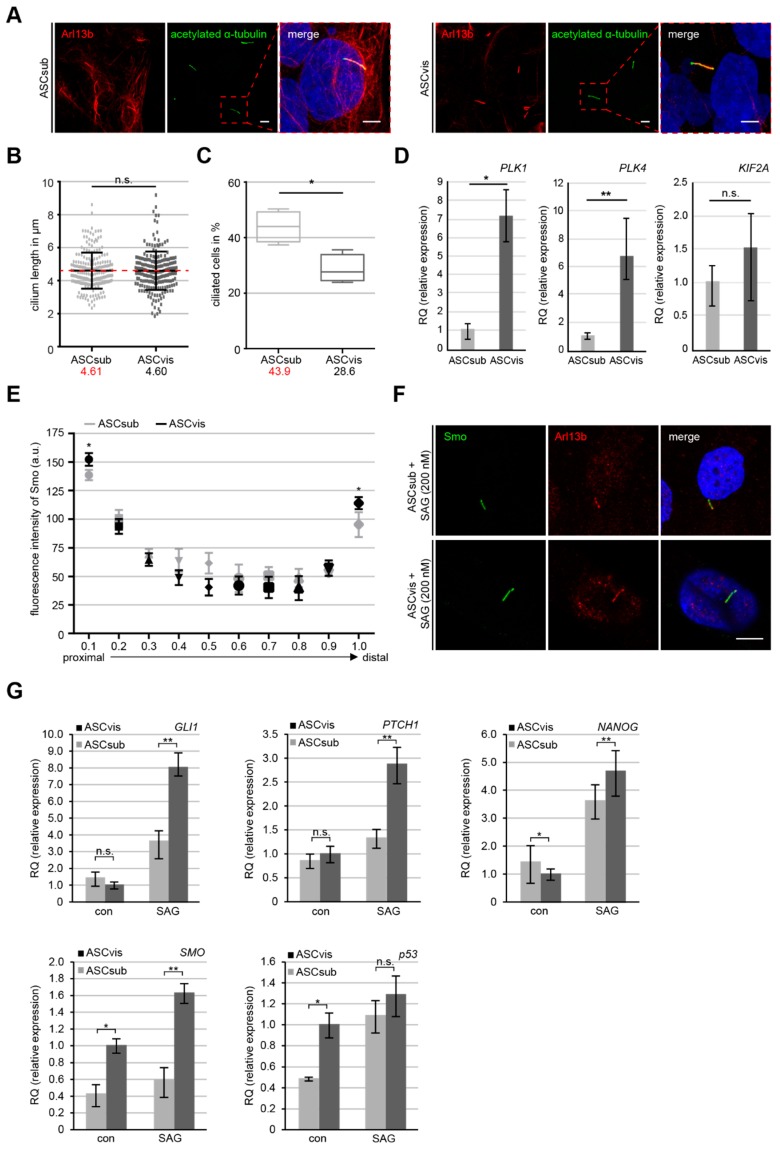
Figure 6.
Visceral ASCs display high deciliation gene levels and enhanced activation of the sonic hedgehog (Hh) signaling pathway. (A) Primary cilia of ASCsub and ASCvis were stained for acetylated α-tubulin and Arl13b. Representatives are shown. Scale: 10 μm. Regions outlined in boxes are shown in a higher magnification. Inset scale: 10 µm. (B) The cilium length was evaluated. The results are based on six experiments using ASCs from six donors (n = 180 cilia for each group). (C) Ciliated ASCs were evaluated and the results are presented as mean ± SEM (n = 600 cells, pooled from six experiments). Unpaired Mann–Whitney U-test, * p < 0.05. (D) The gene levels of deciliation regulators PLK1, PLK4, and KIF2A. The data are based on three experiments and presented as RQ with minimum and maximum range. Student’s t test, ∗ p < 0.05, ** p < 0.01. (E–G) Fluorescence intensities and expression levels of important genes related to the Hh pathway are shown for ASCs treated with SAG for 24 h. (E) Each point of the curve represents the mean fluorescence intensity (mean ± SEM) based on three experiments (n = 30 cilia). Unpaired Mann–Whitney U-test, * p < 0.05. (F) Representatives are shown for measurements of primary cilium staining of acetylated α-tubulin, Arl13b and Smoothened (Smo). Scale: 3 μm. (G) The gene levels of GLI1, PTCH1, NANOG, SMO, and TP53 are shown for ASCs treated or non-treated with 200 nM SAG for 24 h. The results are from three experiments, merged as biological group, and presented as mean ± SEM. Student’s t test, ∗ p < 0.05, ** p < 0.01.

