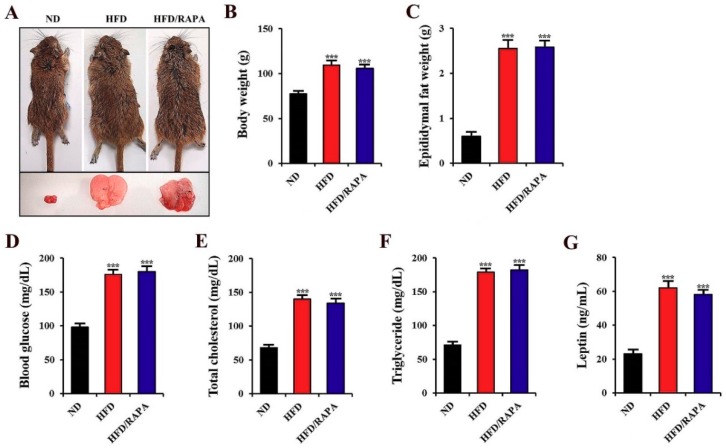
Figure 2.
(A) Representative gerbils from the ND-fed group (left), HFD-fed group (middle), and HFD/RAPA-fed group (right), depicting gross images of whole body (top) and epididymal fat (bottom). (B–G) Physiological parameters, including body weight (B), epididymal fat weight (C), blood glucose (D), serum total cholesterol (E), triglyceride (F), and leptin levels (G). Note that no significant differences were shown between the HFD-fed and HFD/RAPA-fed groups. The bars indicate the means ± SEMs. n = 14/group. *** p < 0.001 versus ND-fed group.

