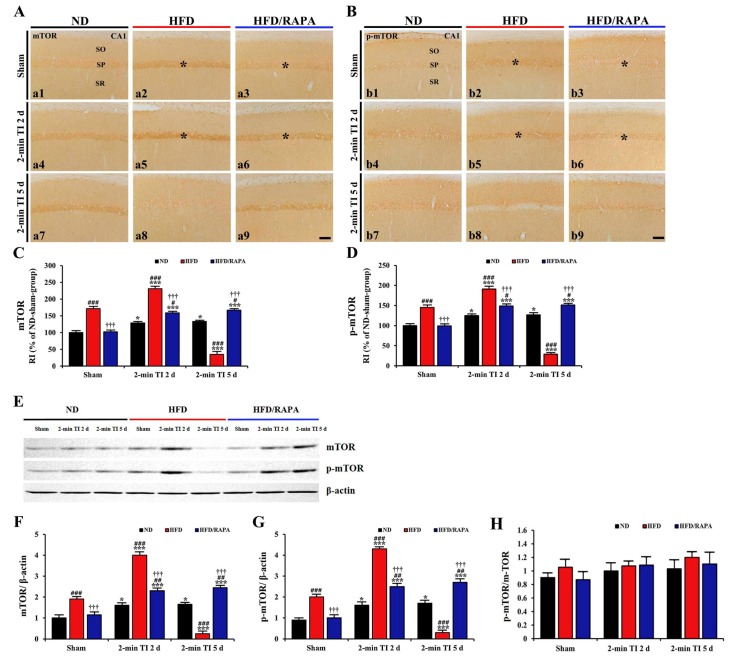
Figure 8.
(A,B) Immunohistochemistry for mTOR (A) and p-mTOR (B) in the CA1s of the ND-fed (left columns), HFD-fed (middle columns), and HFD/RAPA-fed (right columns) groups at sham (a1–a3, b1–b3), 2 days (a4–a6, b4–b6), and 5 days (a7–a9, b7–b9) after 2-min TI. mTOR and p-mTOR immunoreactivity in the HFD-fed group was significantly higher in CA1 pyramidal cells (asterisks) than the ND-fed group at sham (a2, b2) and 2 days (a5, b5) after 2-min TI. In the HFD/RAPA-fed group, mTOR and p-mTOR immunoreactivity (asterisks) was significantly lower (a3, a6, b3, b6) compared to the HFD-fed group. Scale bar = 60 μm. (C,D) Quantitative analyses of mTOR (C) and p-mTOR (D) immunoreactivity in the CA1 pyramidal cells (n = 7/group). RI was calibrated as a percentage, with the ND sham group designated as 100%. The bars indicate the means ± SEMs. * p < 0.05, *** p < 0.001 versus each sham group, # p < 0.05, ## p < 0.01, ### p < 0.001 versus ND-fed group, and ††† p < 0.001 versus HFD-fed group. (E) Western blotting of mTOR and p-mTOR in the CA1 of the ND-fed, HFD-fed, and HFD/RAPA-fed groups at sham, 2 days, and 5 days after 2-min TI. (F, G) Semi-quantification of band intensities of mTOR (F), p-mTOR (G), and p-mTOR/mTOR (H) ratios in the CA1s (n = 7/group). The bars indicate the means ± SEMs. * p < 0.05, *** p < 0.001 versus each sham group, ## p < 0.01, ### p < 0.001 versus ND-fed group, and ††† p < 0.001 versus HFD-fed group.

