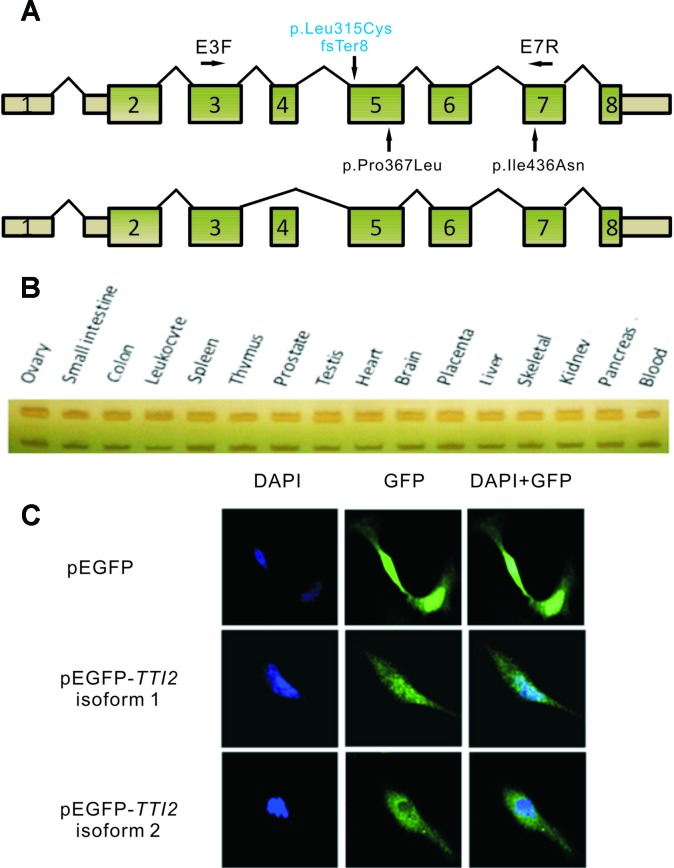
Figure 2.
Schematic map and expression profile of two alternatively spliced TTI2 isoforms. (A) Schematic map of TTI2 showing the normal (upper) or variable spliced isoforms (lower), as well as the positions of mutations. Boxed regions denote exons, and connecting solid lines indicate introns. The mutation above the horizontal axis marked in blue is the novel frameshift mutation identified; those below are missense mutations reported to date. Primers E3F and E7R were used in RT-PCR. (B) Expression profile of the two TTI2 isoforms in 16 types of normal human tissues. (C) SH-SY5Y cells were transfected with empty vector, GFP-tagged TTI2 isoform 1 or isoform 2. Expressed GFP-TTI2 (green) and stained DAPI (blue) were observed.

