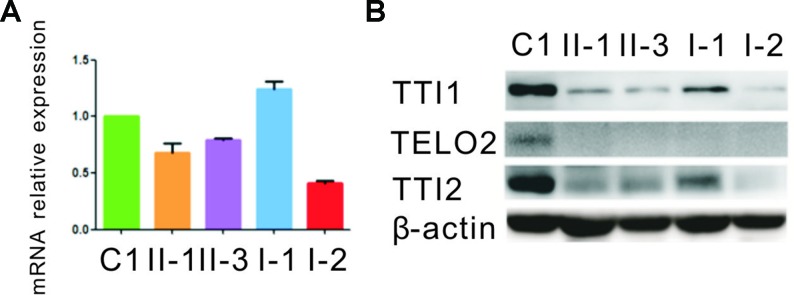
Figure 3.
Quantitative mRNA and protein expression analysis of the TTI2 mutations. (A) Quantitative RT-PCR (qRT-PCR) analysis of TTI2 mRNA in peripheral blood leukocytes from patients (II-1 and II-3), unaffected parents (I-1 and I-2), and a control individual (C1). The results of the quantification of TTI2 transcripts were first normalized to the ACTB housekeeping gene. The values presented are the means of triplicate determinations ± standard deviation (SD). The C1 was set to 1.0. (B) TTI1, TELO2, and TTI2 protein expression in lymphocytes obtained from the family members and C1, with β-actin serving as a loading control. The results represent one of three similar experiments.

