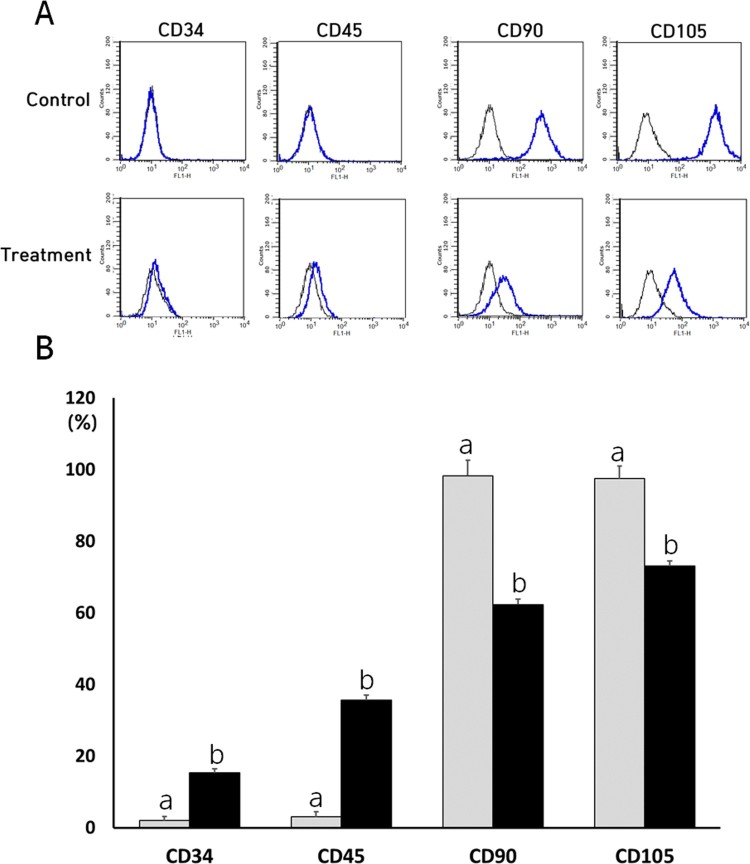
Figure 3.
Representative images by cytometric analysis of cell surface markers (A) and expression analysis of cell surface markers in untreated control (▪) and 250 uM NVP treatment (▪) for 2 weeks. CD34 and CD45 were used as negative marker for MSCs, and whereas CD90 and CD105 were used as positive marker for MSCs, respectively. a and b indicate significant (P < .05) difference between untreated control and NVP treatment, respectively. A representative example of three DSCs is shown in Figure 3(A). The values in Figure 3(B) indicated mean ± SEM of three replicates in each of three DSCs.

