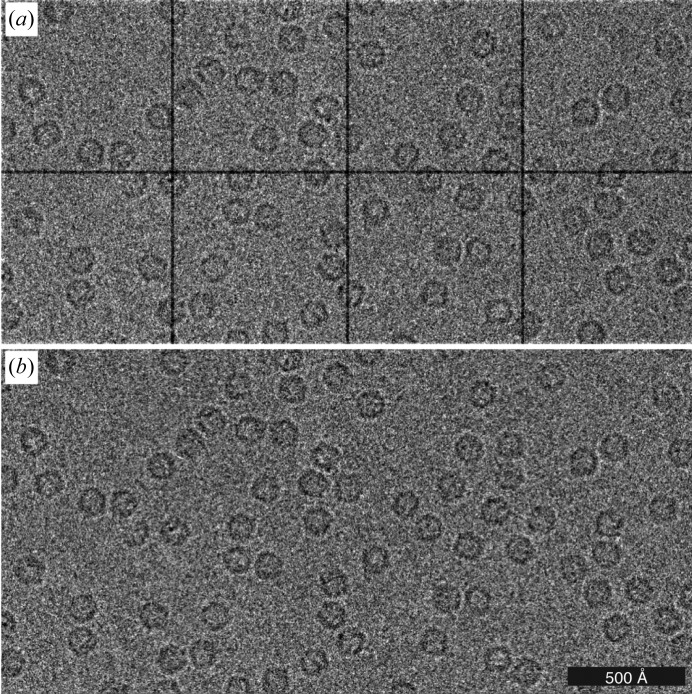
Figure 2.
Example micrographs of apoferritin using 100 keV electrons and a hybrid pixel detector (EIGER X 500 K). (a) The raw micrograph is separated into eight sectors corresponding to each of the ASIC modules with a two-pixel gap between them. (b) The gaps can be removed by gain correction, since the charge between the modules is collected in the neighbouring pixels.

