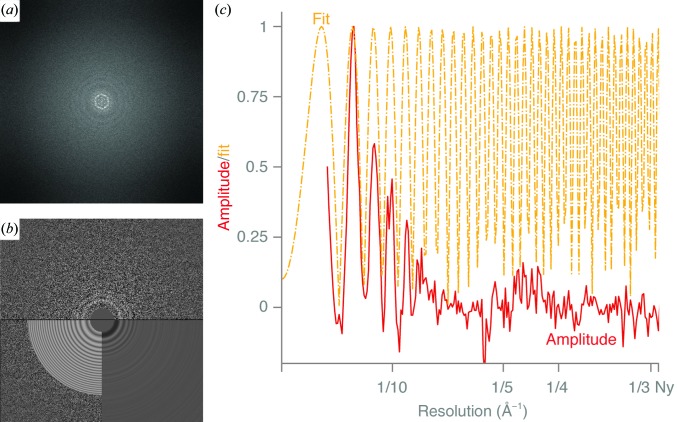
Figure 4.
Contrast transfer function (CTF). (a) Fourier transform of a typical DPS micrograph. The form factor of the molecules and their close-packed ordering in the ice give the strong signals at low frequencies. (b) Fourier transform of the same DPS micrograph, with equiphase averaged Thon rings, and the corresponding CTF fit. (c) Background-subtracted amplitude spectrum (100 keV, ∼1 µm defocus, fitted in CTFFIND4.1, scaled to have a value of 1 at the second peak) (solid red line) and the fit (yellow dashed and dotted line).

