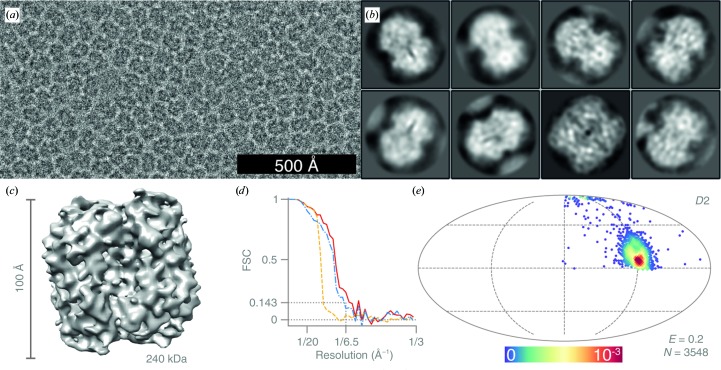
Figure 7.
Structure of catalase determined at 100 keV. (a) Typical micrograph after motion correction. Contrast is adjusted to ±3σ from the mean intensity. (b) 2D class averages, showing mostly side views, except for a single class showing the strongly under-represented top view. (c) Sharpened masked 3D reconstruction of catalase from N = 3548 particles with dihedral (D2) symmetry. (d) Gold-standard FSC plot corresponding to the calculated map, showing the correlation between the phase-randomized (yellow), unmasked (blue) and masked (red) half-maps. The plot terminates at the Nyquist frequency. (e) Orientation distribution of the catalase particles contributing to the final reconstruction (Mollweide projection). All Euler angles are assigned within one asymmetric subunit for the D2 symmetric particle. The colour scale (linear) corresponds to the normalized density of views (blue, low; red, high). E = 0.2 is the efficiency of the orientation distribution, indicating a strong orientation preference, which limits the resolution of the reconstruction.

