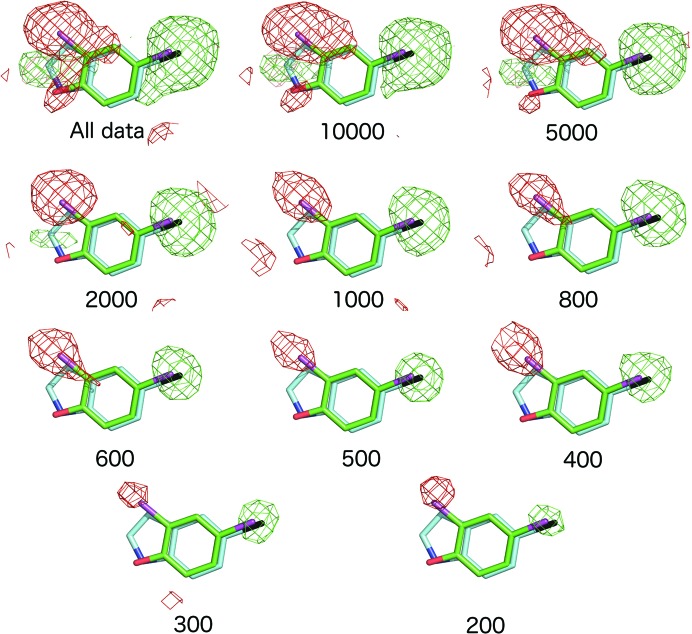
Figure 5.
F o − F o isomorphous difference maps comparing the 5BR and DCP ligand complexes of DHP. Maps are F o(5BR) − F o(DCP) contoured at 3σ. With all data included, the map shows a clear positive peak near to the position of the Br atom of 5BR (black) and one of the Cl atoms of DCP (magenta), consistent with the greater number of electrons in bromine. A negative peak is present at the position of the second Cl atom of DCP, where the closest atom of 5BR is a carbon. An additional but weaker positive peak is present close to the C5 atoms of 5BR where no atom is present in DCP.

