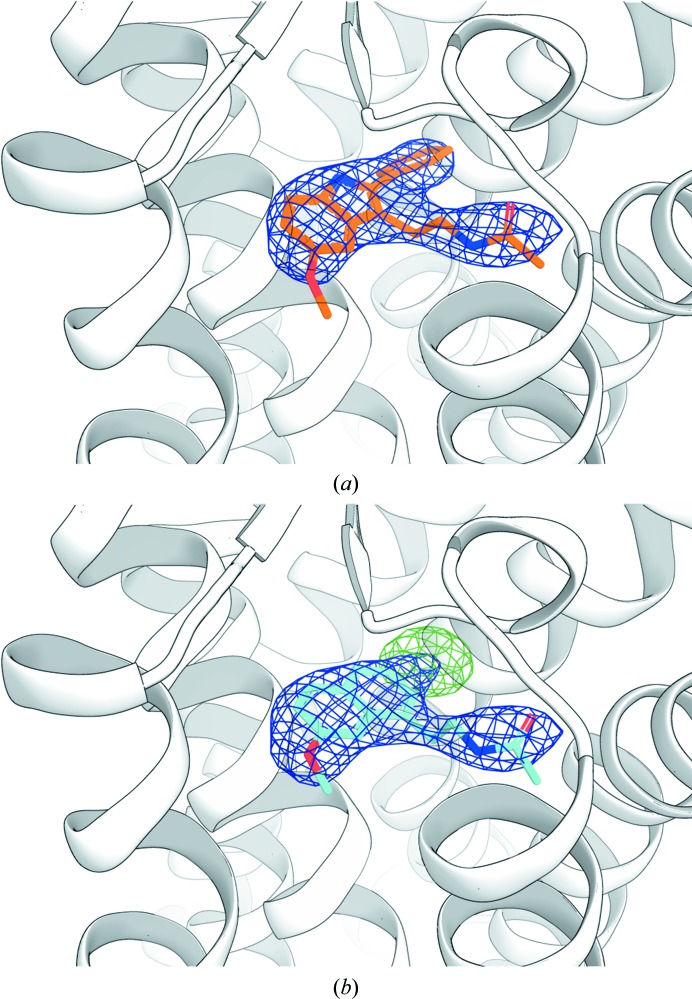
Figure 5.
Electron density in the MT1 ligand-binding pocket. (a) Ligand electron density for MT1 (white cartoon) after ligand exchange of agomelatine (Ago) to 2-phenylmelatonin (2-PMT; orange). (b) Ligand electron density after incorrect placement of the transient ligand Ago (cyan) and refinement starting from the same molecular-replacement structure (see Section 2). Both structural models are of comparable stereochemical quality, but the structure refined with Ago shows slightly worse refinement statistics (R and R free of 0.257 and 0.314 compared with 0.257 and 0.308, respectively). 2mF o − DF c maps (blue mesh) are contoured at 1σ. mF o − DF c electron-density difference maps contoured at ±3.5σ (green and red for positive and negative peaks, respectively) show strong (∼6.7σ) positive difference density for the missing phenyl ring in the structure refined with Ago.

