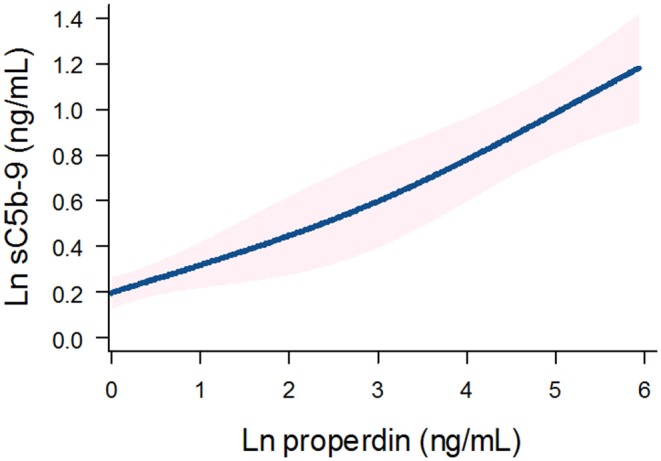
Figure 2.

Association between urinary properdin and urinary sC5b-9 excretion in the RTR. A restricted cubic spline is generated based on linear regression analyses. Knots are placed on 10th, 50th, and 90th percentile of ln properdin. Blue line represents the coefficient, and pink band represents the 95% confidence interval.
