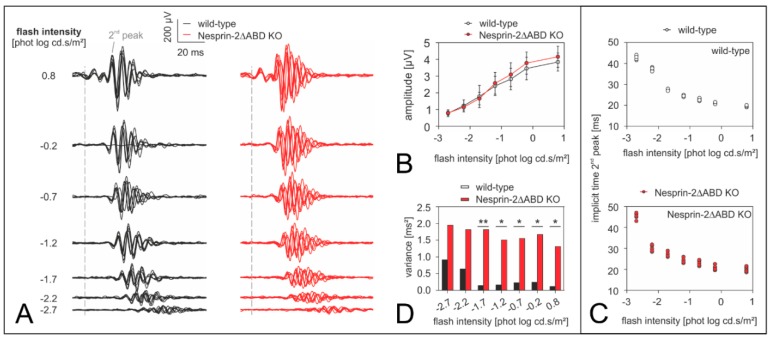
Figure 5.
Analysis of the oscillatory potentials isolated from the scotopic flash-ERG in the retina of Syne-2/Nesprin-2 KO mouse strain (age 2–4 month). (A) Individual oscillatory potential traces from each wild-type (black curves, n = 7) and Syne-2/Nesprin-2 KO mouse (red curves, n = 7) are shown for each scotopic flash intensity. Note that the curves were more varied in time (i.e., less synchronized) within the Syne-2/Nesprin-2 KO group. As such, group averaged (mean ± sd) intensity-response amplitudes of the 2nd oscillatory peak are shown in (B), whereas individual implicit times plots are displayed in (C) so as to better visualize the spread in each group. Although both wild-type and Syne-2/Nesprin-2 KO implicit time profiles exhibited the same trend with increasing flash intensity, the inter-individual variability was larger in the Syne-2/Nesprin-2 KO group. This was more obvious when (D) the variances of the implicit times of the two mouse groups were compared. Statistical significance is denoted with a * p < 0.05 or ** p < 0.005 (Levene’s test).

