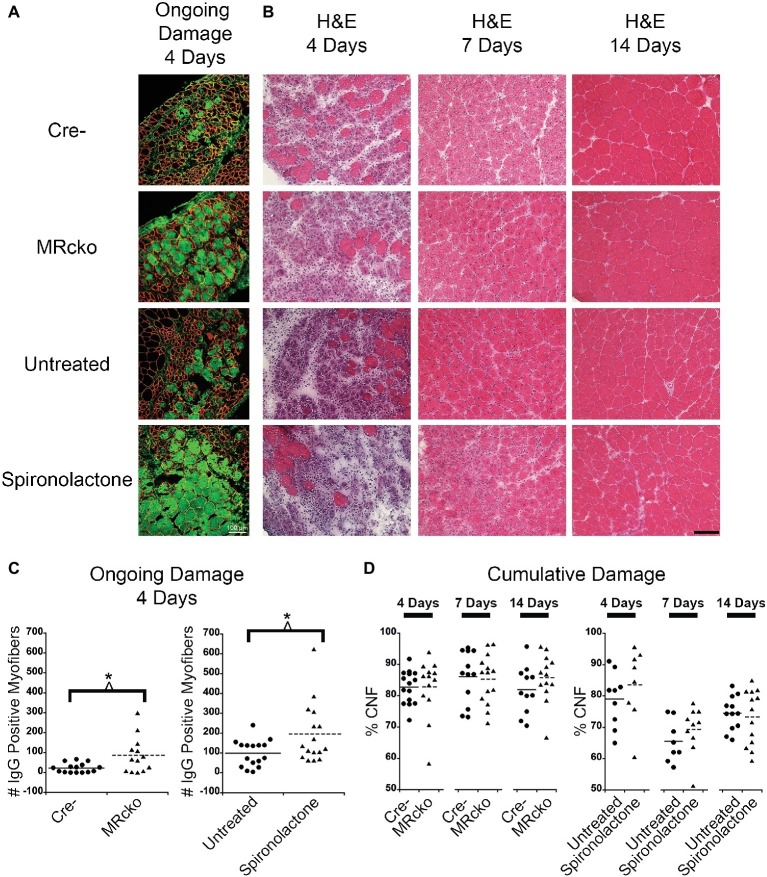
Figure 3.
Increased percentages of degenerating myofibers in both MRcko and MR antagonist-treated wild-type mice. (A) Representative confocal images of IgG and laminin staining of 4 days post-injury tibialis anterior (TA) sections. Scale bar = 100 μm. (B) Representative TA sections at 4, 7, and 14 days post-injury stained with hematoxylin and eosin. Scale bar = 100 μm. (C) Dot plots showing number of IgG positive fibers at 4 days post-injury for MRcko and Cre− littermates (n = 15 Cre−, and 13 MRcko) and spironolactone treated and untreated wild-type littermate mice (n = 16 untreated, and 16 spironolactone). Means are shown by lines for each group in the dot plot. (D) Dot plots showing percent of myofibers with centralized nuclei in MRcko mice and control littermates at 4 (n = 15 Cre−, and 13 MRcko), 7 (n = 12 Cre−, and 14 MRcko), and 14 (n = 11 Cre−, and 13 MRcko) days post-injury and spironolactone-treated mice at 4 (n = 9 untreated, and 8 spironolactone), 7 (n = 8 untreated, and 10 spironolactone), and 14 (n = 12 untreated, and 13 spironolactone) days post-injury. Means are shown by lines for each group. H & E, hematoxylin and eosin; data were analyzed using a Student’s t-test; *p ≤ 0.05.

