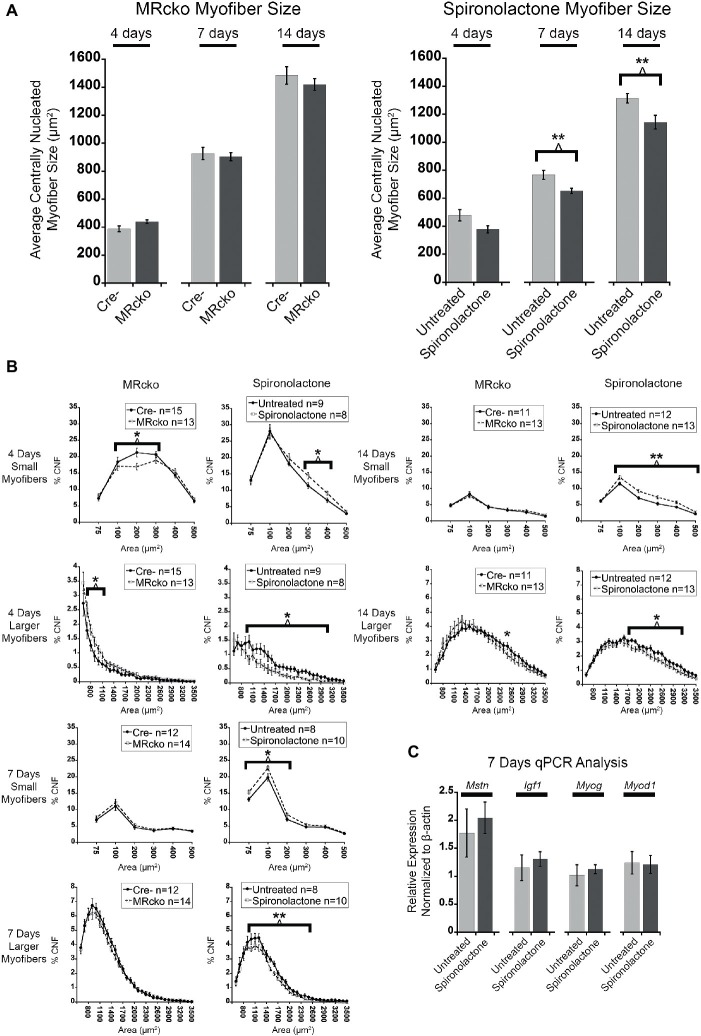
Figure 4.
MR antagonism reduces myofiber size after acute muscle injury. (A) Bar graphs showing the average size of centrally nucleated tibialis anterior myofibers at 4 (n = 15 Cre−, and 13 MRcko) (n = 9 untreated, and 8 spironolactone), 7 (n = 12 Cre−, and 14 MRcko) (n = 8 untreated, and 10 spironolactone), and 14 (n = 11 Cre−, and 13 MRcko) (n = 12 untreated, and 13 spironolactone) days post-injury in MRcko versus Cre− mouse littermates (left panel) and MR antagonist-treated and untreated wild-type littermate mice (right panel). The data are presented as mean ± SEM. **p ≤ 0.01. (B) The distribution of centrally nucleated myofiber percentages was broken down by size in line graphs into small myofibers 75–600 μm2 and larger myofibers 600–3,600 μm2. The centrally nucleated myofiber size was analyzed at 4 (n = 15 Cre−, and 13 MRcko) (n = 9 untreated, and 8 spironolactone), 7 (n = 12 Cre−, and 14 MRcko) (n = 8 untreated, and 10 spironolactone), and 14 (n = 11 Cre−, and 13 MRcko) (n = 12 untreated, and 13 spironolactone) days post-injury. For size analysis, the following numbers of centrally nucleated myofibers were analyzed for each group and days post-injury: 2,653 ± 105 Cre− and 2,584 ± 161 MRcko at 4 days post-injury, 2,810 ± 166 Cre− and 2,818 ± 181 MRcko at 7 days post-injury, 3,103 ± 157 Cre− and 3,173 ± 193 MRcko at 14 days post-injury, 2,466 ± 167 untreated and 2,697 ± 167 spironolactone treated at 4 days post-injury, 2,465 ± 165 untreated and 2,629 ± 130 spironolactone treated at 7 days post-injury, and 2,730 ± 159 untreated and 3,019 ± 157 spironolactone treated at 14 days post-injury. (C) Bar graph showing representative myogenic factor and myofiber growth genes assessed in spironolactone treated (n = 5) and untreated (n = 5) littermates at 7 days post-injury. Beta-actin levels are used as a normalization control for each sample and fold-changes are normalized to the same untreated control. Mstn, myostatin; Igf1, insulin-like growth factor 1; Myog, myogenin; Myod1, myoblast determination protein 1. The data are presented as mean ± SEM. All data were analyzed using a Student’s t-test, *p ≤ 0.05 and **p ≤ 0.01 for the bins of fiber-sizes shown by the bracket.

