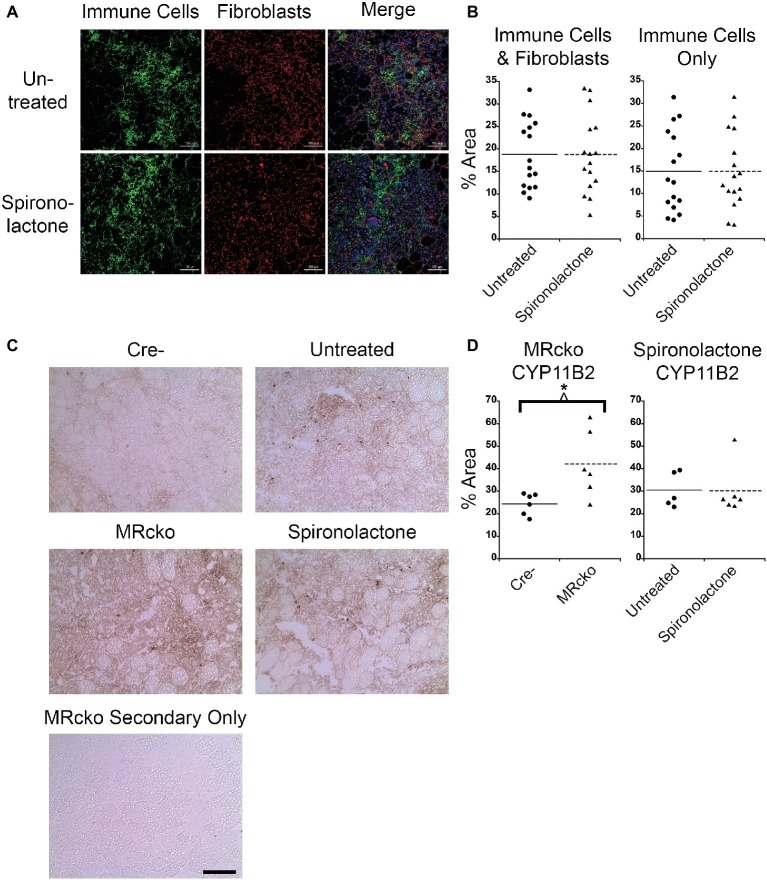
Figure 5.
MRcko mice have increased CYP11B2 infiltration at 4 days post-injury. (A) Acutely injured tibialis anterior (TA) muscles of spironolactone treated and untreated mice at 4 days after acute injury were stained for CD11b to visualize myeloid immune cells (green), vimentin to visualize fibroblasts (red), and with DAPI to visualize nuclei (blue in merged image) and were imaged with confocal microscopy. Zoomed out images are shown to depict the areas of muscle infiltrated by immune cells (green dots) or fibroblasts (red dots) quantified in B. Scale bar = 100 μm. (B) Dot plots of spironolactone treated and untreated mouse (n = 16 spironolactone, and 16 untreated) TA muscle percent area at 4 days post-injury of immune cells and fibroblast infiltration together or percentage of myeloid immune cells infiltration alone. Means are shown by lines for each group in the dot plots. (C) CYP11B2 immunohistochemistry was analyzed at 4 (n = 6 Cre−, and 6 MRcko) (n = 5 untreated, and 6 spironolactone) days post-injury. Scale bar = 100 μm. (D) Dot plots of CYP11B2 percent infiltration at 4 days post-injury. Means are shown by lines for each group in the dot plots. All data was analyzed using a Student’s t-test. *p ≤ 0.05.

