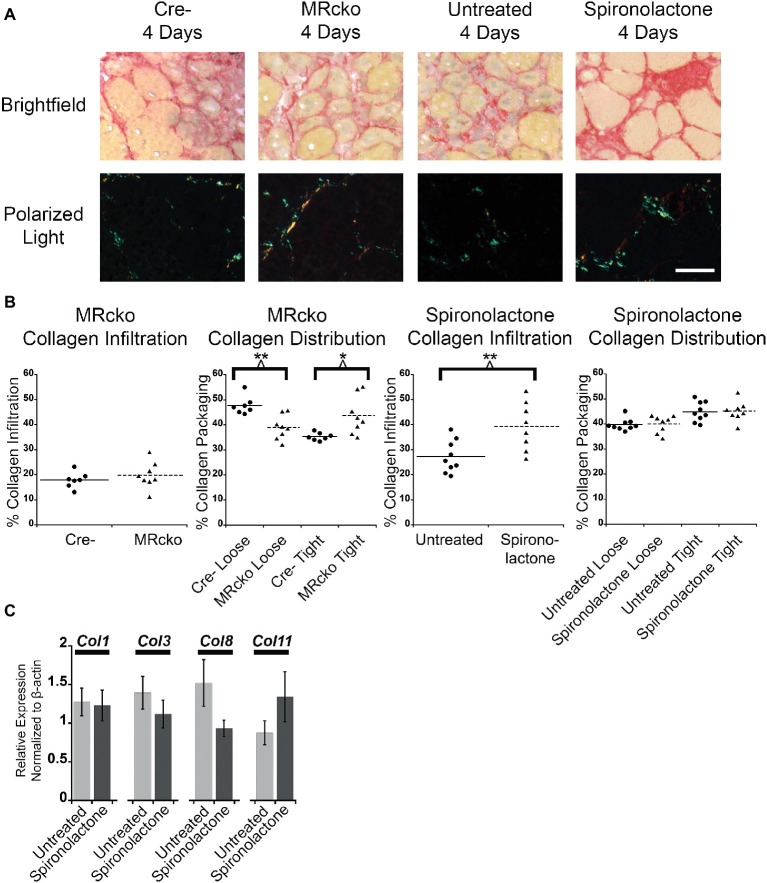
Figure 6.
MRcko and MR antagonist treatment results in increased detrimental collagen infiltration. (A) Representative images of tibialis anterior muscle after picrosirius red staining under brightfield to quantify total collagen and polarized light to quantify collagen packaging. Loosely packaged collagen appears green and tightly packaged collagen appears red under polarized light. Scale bar = 40 μm (B) Dot plots of percent muscle area containing collagen infiltration and percent of loosely and tightly packaged collagen at 4 days after acute muscle injury for MRcko mice (n = 7 Cre−, and 8 MRcko) and spironolactone-treated mice (n = 8 untreated, 8 spironolactone) Means are shown by lines for each group in the dot plots. (C) Bar graph showing four representative collagen genes involved in fibrosis assessed in spironolactone treated (n = 5) and untreated (n = 5) littermates. Beta-actin levels were used as a normalization control. Col1, collagen 1 alpha 1; Col3, collagen 3 alpha 1; Col8, collagen 8 alpha 1; Col11, collagen 11, alpha 1. Data are presented as mean ± SEM. All data were analyzed using a Student’s t-test, *p ≤ 0.05 and **p ≤ 0.01.

