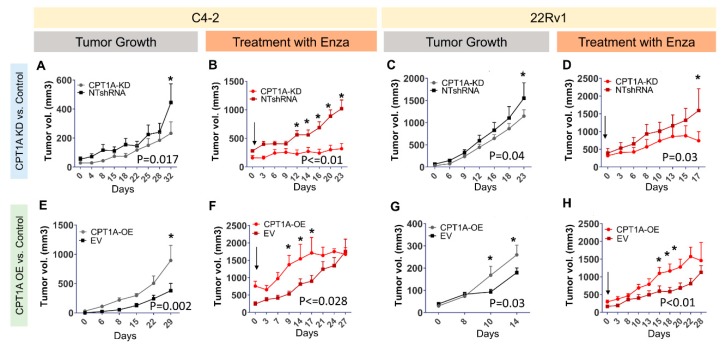
Figure 5.
CPT1A expression in tumors modulates their growth and the response to enzalutamide in castrated mice. NSG mice were used for the C4-2 cells and nu/nu mice for 22Rv1 cells. Mice were castrated 2 weeks before cell implantations. Figures (A) and (C) show tumor growth curves for C4-2 and 22Rv1 with CPT1A-KD and control NT-shRNA cells, respectively. Similarly, Figures (E) and (G) show tumor growth curves for C4-2 and 22Rv1 with CPT1A-OE and EV control cells, respectively. In separate experiments, mice received oral gavage of 20 mg/kg enzalutamide (Enza) once tumors were established and growing (≥300 cc). Figures (B) and (D) show response to Enza in tumors with CPT1A-KD, whereas figures (F) and (H) show response to Enza in tumors overexpressing CPT1A (OE). Significance differences are indicated (*) for each group. Mouse numbers per graph: (A): (NT = 11, KD = 13), (B): (NT = 5, KD = 5), (C): (NT = 12, KD = 14), (D): (NT = 5, KD = 5), (E): (EV = 8, OE = 8), (F): (EV = 6, OE = 6), (G): (EV = 7, OE = 7), (H): (EV = 5, OE = 5).

