Figure 1.
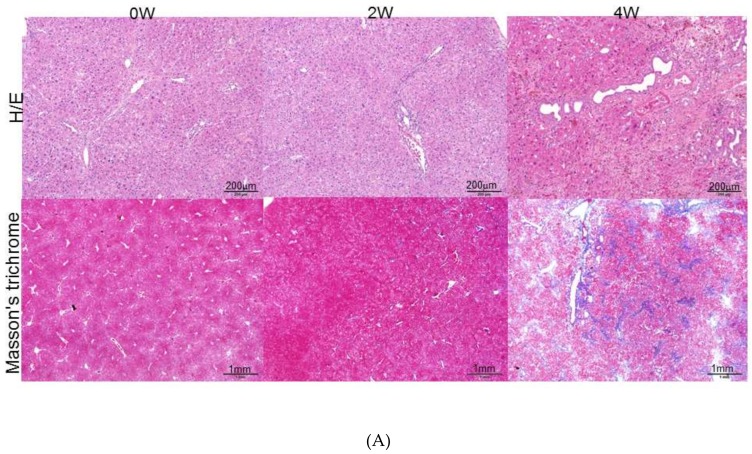
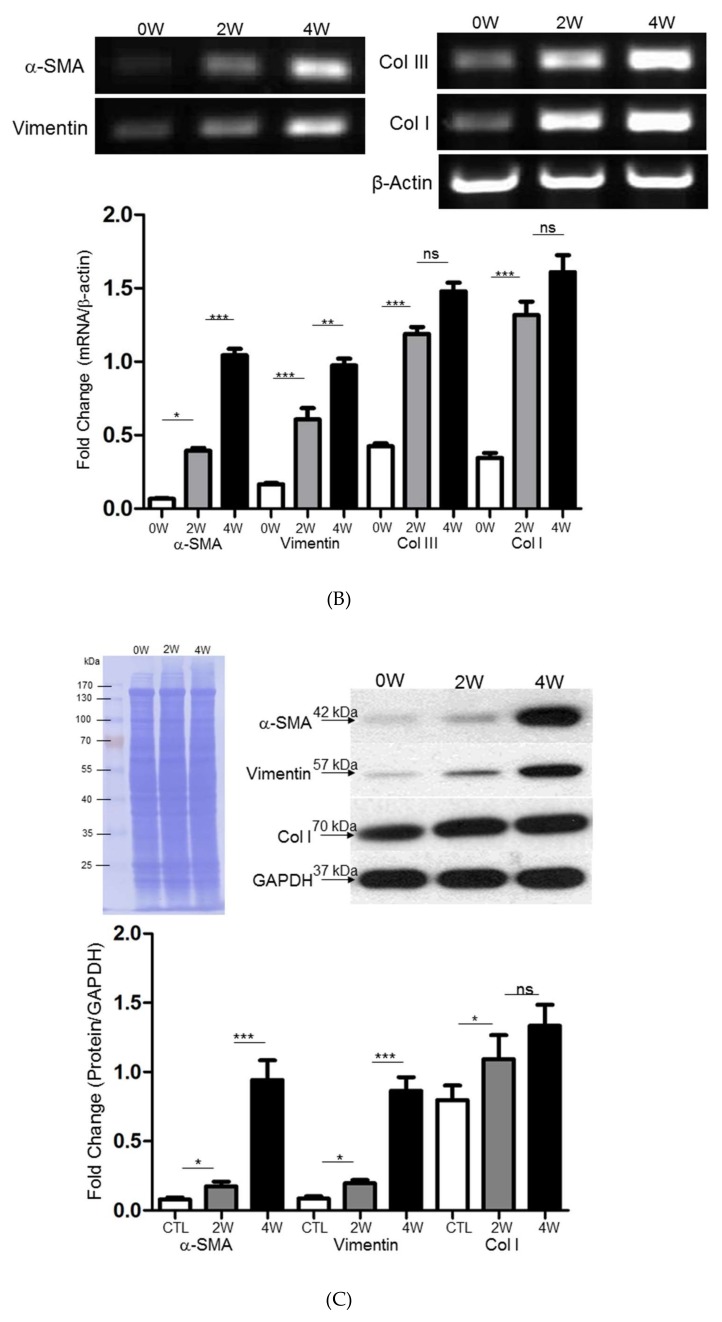
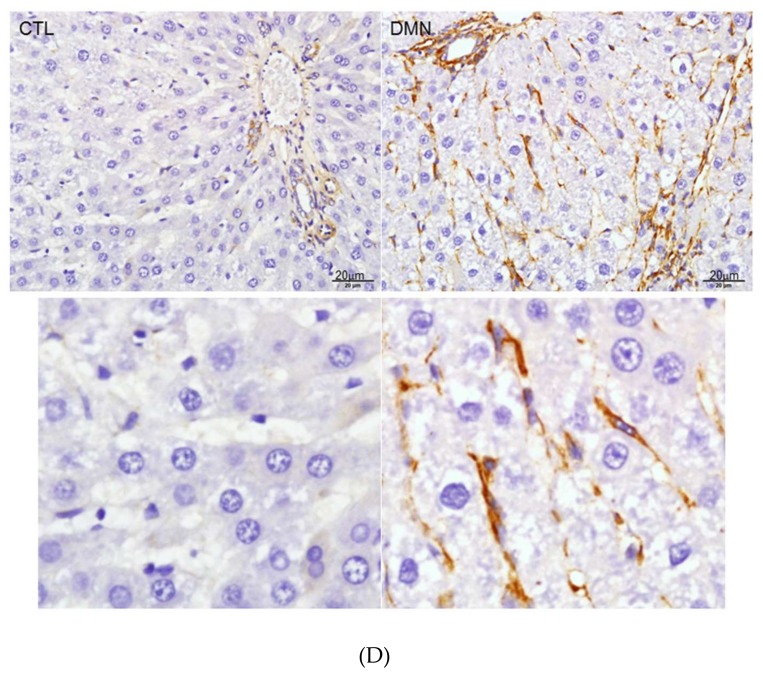
(A) Histologic examination of rat liver at zero week (0W), two weeks (2W), and four weeks (4W). Upper panels: Hematoxylin–eosin (H/E) staining indicated necrosis of hepatocytes and infiltrated lymphocytes. Lower panels: Masson’s trichrome staining of rat liver tissues. The images indicated accumulation of collagen around portal tracts as blue images. (B) Validation of α-smooth muscle actin (α-SMA), vimentin, collagen type III (Col III), and collagen type I (Col I) expression by RT-PCR after treatment of dimethylnitrosamine (DMN). β-Actin was used as an internal control. The quantified results were indicated by the bar chart and represent the mean ± SD of three independent experiments (* p < 0.05, ** p < 0.01, *** p < 0.001, ns: no significance). (C) Confirmation of change in extracellular matrix (ECM) protein level after DMN application. Protein expression of α-SMA, vimentin, and Col I was assessed by a Western blot analysis. Glyceraldehyde-3-phosphate dehydrogenase (GAPDH) was used as an internal control. Polyvinylidene difluoride (PVDF) membrane stained with Coomassie blue R-250 was utilized to perform loading amount of proteins. The quantified results were presented by the bar chart (* p < 0.05, *** p < 0.001, ns: no significance.). The results are representative of the rats used in each group (n = 6). (D) Immunohistochemical study of vimentin expression in representative liver tissues obtained from samples treated with or without DMN at four weeks (4W). The regions with differently expressed vimentin were shown by brown color. The lower panels presented the zoom figures.


