Figure 5.
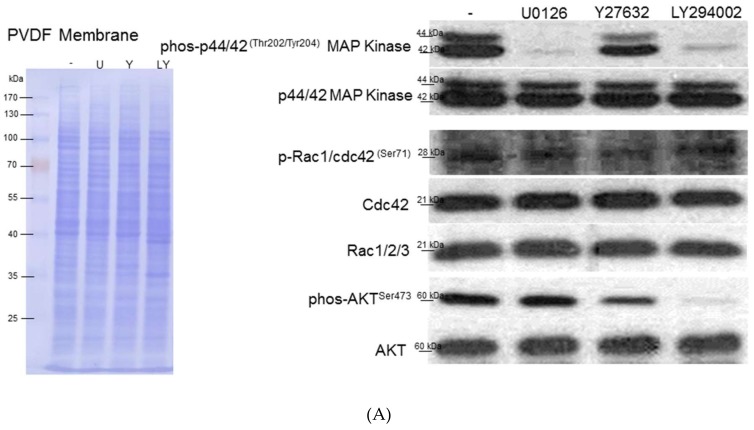
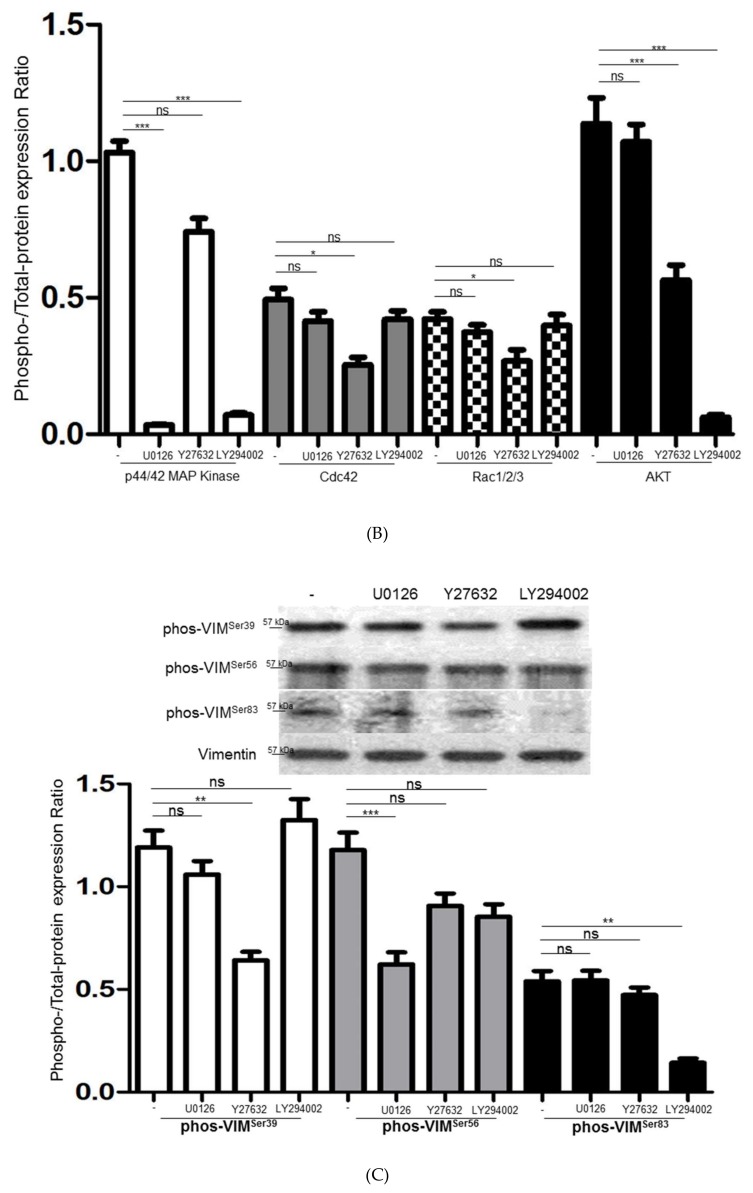
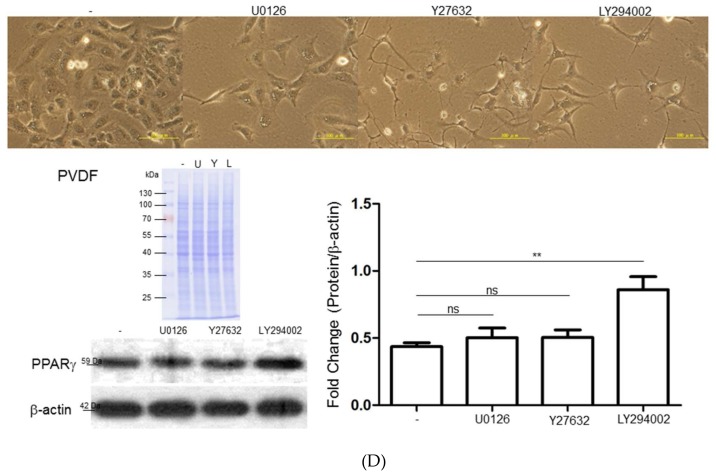
(A) Western blot analysis for phosphorylation and total protein levels of ERK1/2, Cdc42, Rac1/2/3, and AKT with application of different inhibitors including U0126, Y27632, and LY294002. PVDF membrane stained with Coomassie blue R-250 was utilized to perform loading amount of proteins. (B) The phosphorylation levels were normalized by total protein levels and the corresponding results represented the mean ± SD of three independent experiments (*p < 0.05, *** p < 0.001, ns = no significance). (C) The expressed levels of various phosphorylated sites of vimentin were modulated under treatment of specific inhibitors such as U0126, Y27632, and LY294002. The quantified results were indicated by the bar chart and represented the mean ± SD of three independent experiments (** p < 0.01, *** p < 0.001, ns = no significance). (D) Upper panels: The morphological alteration of HSC-T6 cells treated with various inhibitors including U0126, Y27632, and LY294002. The scale bar is 100 μm. Lower panels: The changes of PPARγ under exposure of different inhibitors were evaluated by Western blot analysis. The intensity of the signals was quantitated by normalizing with respect to β-actin used as internal controls. The quantified results were indicated by the bar chart and represented the mean ± SD of three independent experiments (** p < 0.01, ns = no significance).


