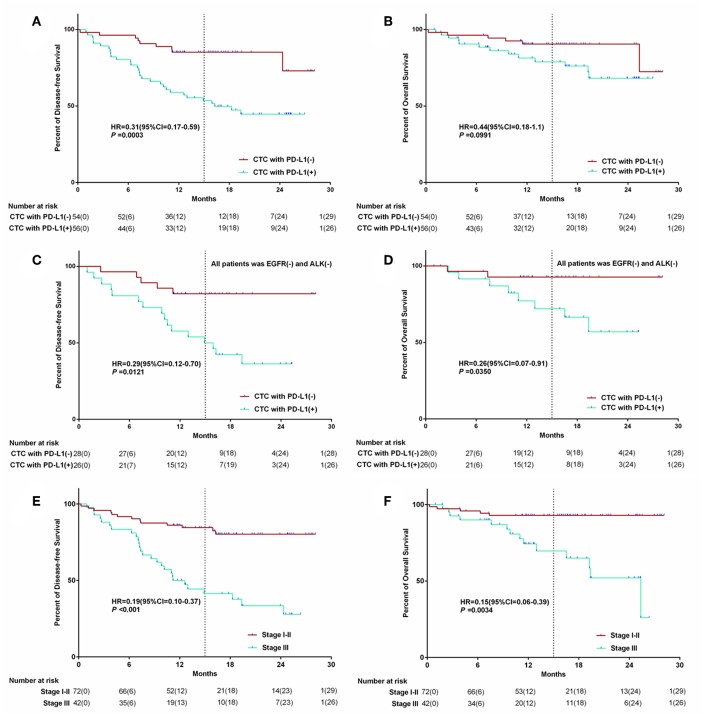
Figure 4.
The Kaplan–Meier survival curve of PD-L1 (+) CTC number and stage of patient association with survival. The relationship between PD-L1 expreesion in CTC and survival (A,B); The relationship between PD-L1 expreesion in CTC for the wild type EGFR&ALK patients and survival (C,D); The relationship between Stage and survival (E,F).

