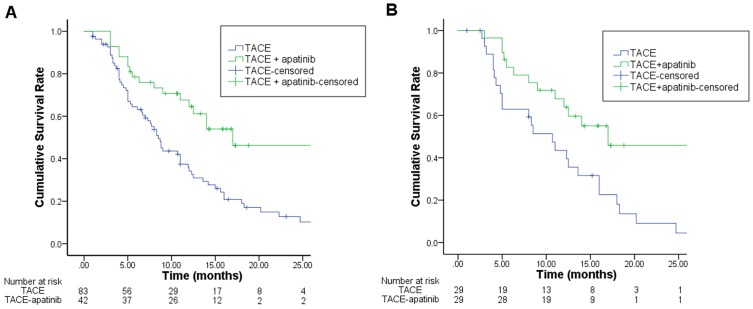
Figure 2.
Kaplan–Meier curves of OS for TACE+apatinib and TACE groups before (A) and after PSM (B).
Notes: The significant increase of OS can be both observed in the TACE-apatinib group compared with the TACE-alone group before (A) and after PSM (B).Abbreviations: OS, overall survival; TACE, transcatheter arterial chemoembolization; PSM, propensity score matching.

