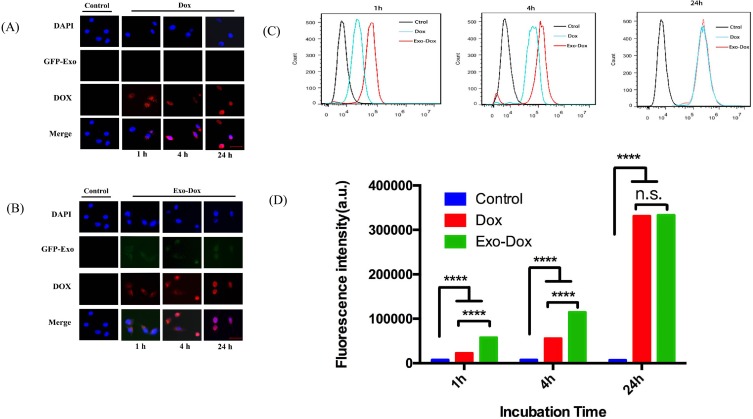
Figure 3.
Intracellular distribution of Dox (A) and Exo-DOX (B) after 1 hrs, 4 hrs and 24 hrs incubation with MG63 cells, bar was 50μm. The histogram (C) and Quantification (D) of internalized Dox, Exo-Dox using flow cytometry after incubation with MG63cells for 1 h,4 h and 24 h. All of the data are presented as mean±s.d. (n=3) and analyzed with two-way ANOVA (****P < 0.0001).

