
Figure 1.
Bland–Altman plots displaying 95% LoA in pair-wise device comparisons: heart rate at rest, ZB and Charge HR (a); heart rate during mCAFT, ZB and Charge HR (b); heart rate during recovery, ZB and Charge HR (c); steps taken during mCAFT, Charge HR and Fitbit One (d); and energy expenditure during mCAFT, Charge HR and Fitbit One (e).
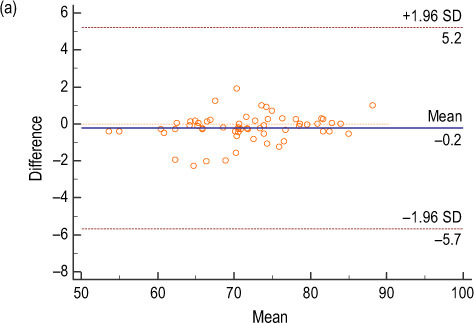
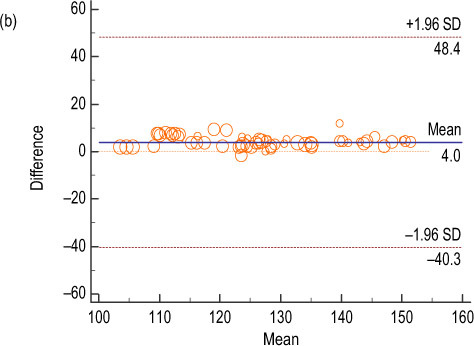
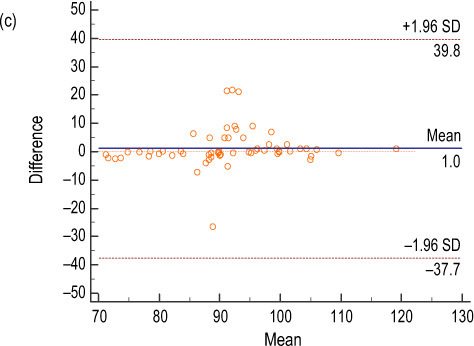
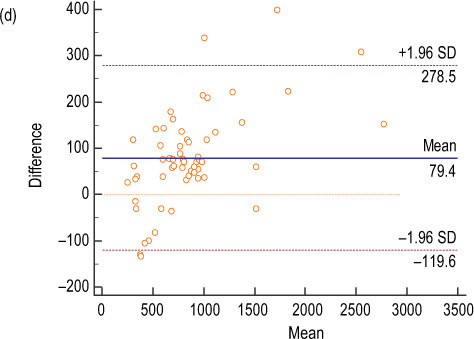
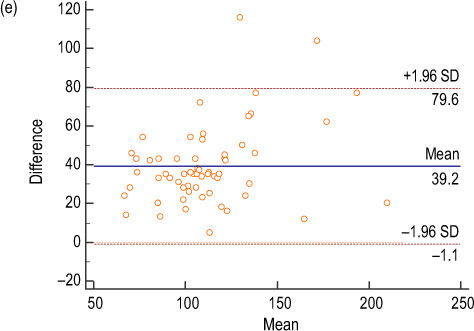
LoA = limits of agreement; ZB = Zephyr BioHarness; Charge HR = Fitbit Charge Heart Rate; mCAFT = modified Canadian Aerobic Fitness Test.