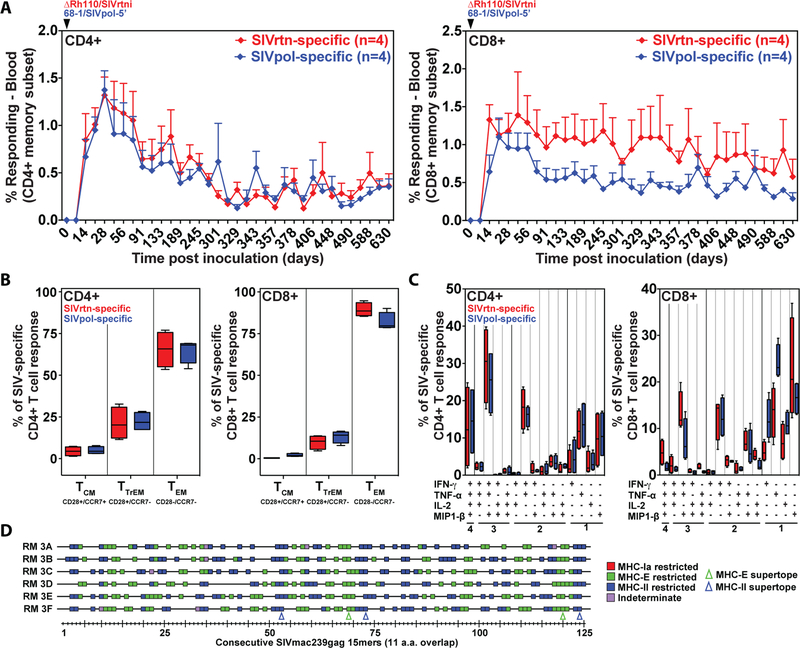
Figure 3: Durability, functional phenotype, and epitope targeting of SIV insert-specific T cell responses elicited by Rh110 (pp71)-deleted RhCMV vectors in naturally RhCMV-infected RMs.
(A) Four naturally RhCMV-infected RMs were co-inoculated with 107 PFU of 68–1/SIVpol-5’ and the same dose of ΔRh110/SIVrtni and flow cytometric ICS was used to follow the magnitude of the CD4+ and CD8+ T cell responses in peripheral blood to SIVpol and SIVrtn peptide mixes as described in Fig. 2. The mean + SEM of SIVpol- and SIVrtn-specific response frequencies within the memory CD4+ (left panel) and CD8+ (right panel) T cell populations are shown. (B) Boxplots compare the memory differentiation of the RhCMV-elicited CD4+ and CD8+ memory T cells in PBMCs (of the same RM shown in panel A) responding to SIVpol or SIVrtn with TNF-α and/or IFN-γ production at 630 dpi. Memory differentiation state was based on CD28 and CCR7 expression, delineating central memory (TCM), transitional effector memory (TTrEM), and effector memory (TEM), as designated. The Wilcoxon rank sum test was used to pairwise compare differences between the fraction of SIVpol- and SIVrtn-specific CD4+ and CD8+ T cells within each memory subset, with P = NS for all comparisons. (C) Boxplots compare the frequency of RhCMV-elicited CD4+ and CD8+ memory T cells in PBMCs of the same RM shown in panel A responding to SIVpol or SIVrtn peptides with TNF-α, IFN-γ, IL-2, and MIP1-β production, alone and in all combinations at 630 dpi. The Wilcoxon rank sum test was used to pairwise compare differences between the fraction of SIVpol- and SIVrtn-specific CD4+ and CD8+ T cells expressing 1, 2, 3 or 4 cytokines, with P = NS for all comparisons. (D) SIVgag-specific CD8+ T cells in the peripheral blood of six ΔRh110/SIVgag-inoculated RMs were epitope-mapped using a flow cytometric ICS assay (CD69, TNF-α, IFN-γ readout, as described above) to detect recognition of each consecutive, overlapping 15-mer peptide comprising the SIVgag protein. Peptides resulting in specific CD8+ T cell responses are indicated by a box, with the color of the box designating MHC restriction as determined by blocking with the anti-pan-MHC-I mAb W6/32, the MHC-E blocking peptide VL9 and the MHC-II blocking peptide CLIP, as previously described (52,53). The blue and green arrowheads indicate the positions of previously identified MHC-II- and MHC-E-restricted SIVgag supertopes, respectively.

