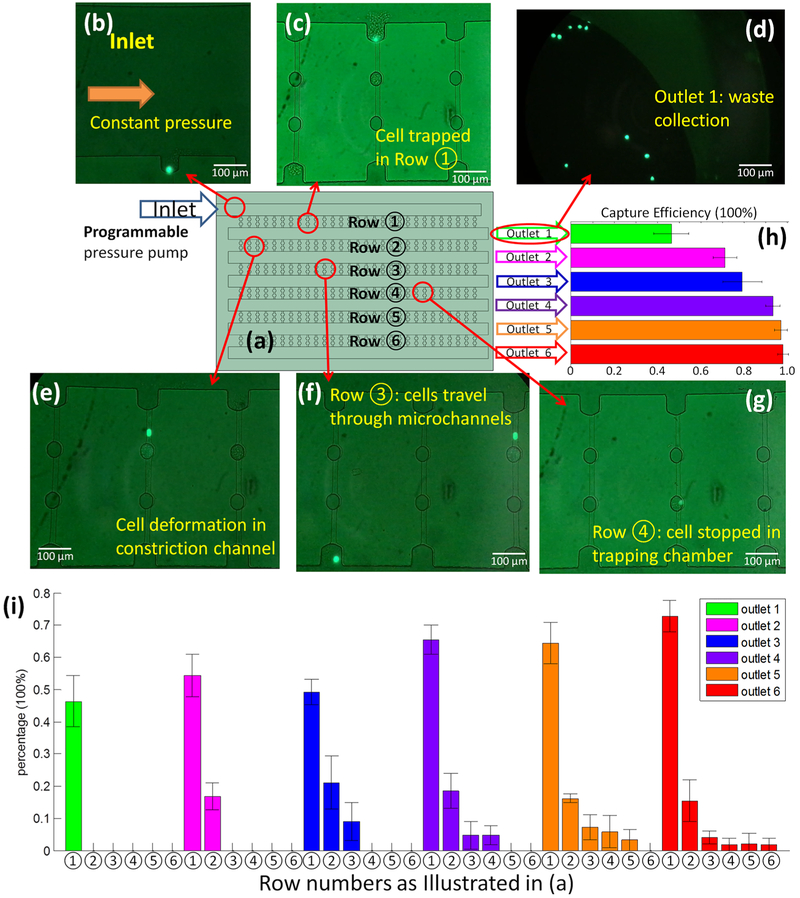
Figure 3.
(a) Illustration of the configuration of the device (not to scale) with the inlet connected to programmable pressure pump; each row and each outlet was assigned and labeled individually; (b–g) the GFP+ LNCaP-C4–2 prostate cancer cells; (b) image of inlet with a GFP+ cell starting to enter row ①; (c) a GFP+ cell trapped in row ① after the blood flow ceased; (d) image of the waste collection at outlet 1; (e) a GFP+ cell deforming and passing through row ②; (f) two GFP+ cells in row ③ with one cell still passing and one cell exiting this row; (g) one GFP+ cell trapped in the trapping chamber of row ④; (h) the overall capture efficiency of each outlet. The data presented here is from three or four runs on CTC-HTECH device; (i) the percentage of the trapped GFP+ cells in every available row in the configuration where the indicated outlet was open (outlet 1 (green), outlet 2 (pink), outlet 3 (blue), outlet 4 (purple), outlet 5 (orange), and outlet 6 (red)).

