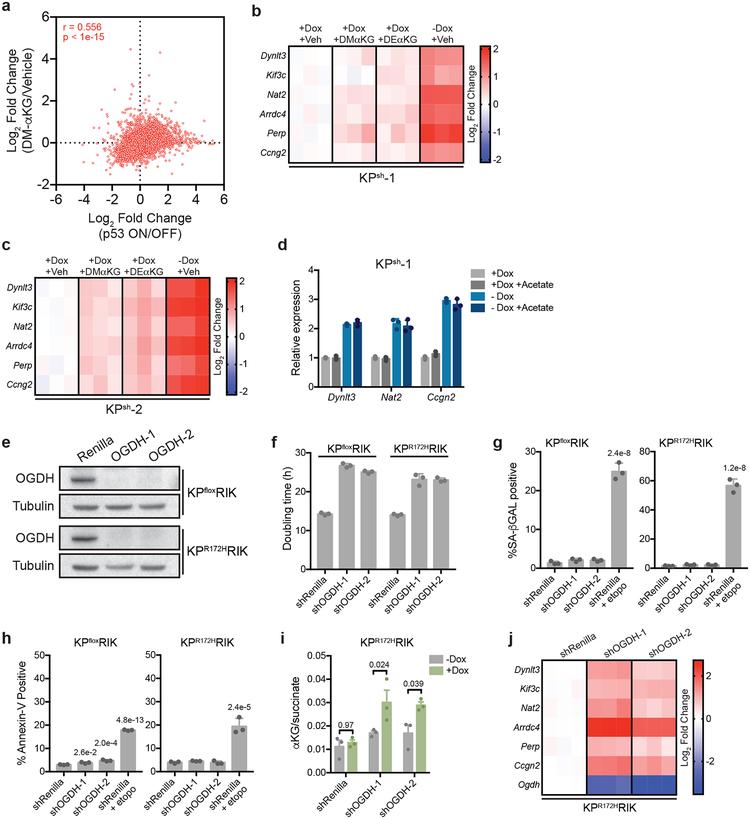
Extended Data Figure 6. Elevating intracellular αKG levels phenocopies the effect of p53 reactivation on gene expression.
a, Mean log2 fold change of all genes following p53 reactivation or cell-permeable αKG in n=2, independently treated wells of KPsh-1 cells. All samples treated with equal amounts of DMSO (vehicle). Spearman correlation r = 0.556, p < 1e-15. b, c qRT-PCR of genes upregulated with both p53 restoration and αKG in KPsh-1 (b) and KPsh-2 (c) cells treated for 72 hours with vehicle, dimethyl-αKG (DM-αKG), diethyl-αKG (DE-αKG) or following p53 restoration (-dox 8 days). d, qRT-PCR of PanIN-cell associated genes in KPsh-1 cells grown on/off dox and treated with 4 mM sodium acetate for 72 h. e, Ogdh immunoblot in p53 null KPfloxRIK or p53 mutant KPR172HRIK cells expressing shOgdh for 4 days. f, Doubling time, day 1–4, of KPfloxRIK and KPR172HRIK cells expressing dox-inducible shOgdh or shRenilla. g,h, Percentage SA-βGAL positive (g) or Annexin-V positive (h) shRNA expressing KPfloxRIK and KPR172HRIK cells off/on dox for 4 days. Etoposide (etopo, 96hrs, 3 μM) included as a positive control. i, αKG/succinate ratio of KPCR172HRIK cells expressing dox-inducible shOgdh or shRenilla grown 4 days off/on dox. j, qRT-PCR of p53/αKG co-regulated genes in shOgdh KPR172HRIK cells compared to shRenilla controls. b-d,i,j were repeated twice with similar results and e was performed once. f-h were repeated in 2 additional lines. For gel source data (e), see Supplementary Figure 1. Data presented as individual data points (b,c,j). mean ± SD (d,f,g,h), mean ± SEM (i), or as a representative image (e) of n=3, independently treated wells of a representative experiment with individual data points shown. Significance assessed in the indicated comparisons by 2-way ANOVA with Sidak’s multiple comparison post test (i) or compared to shRenilla expressing cells by 1-way ANOVA with Tukey’s multiple comparison post-test (g,h).

