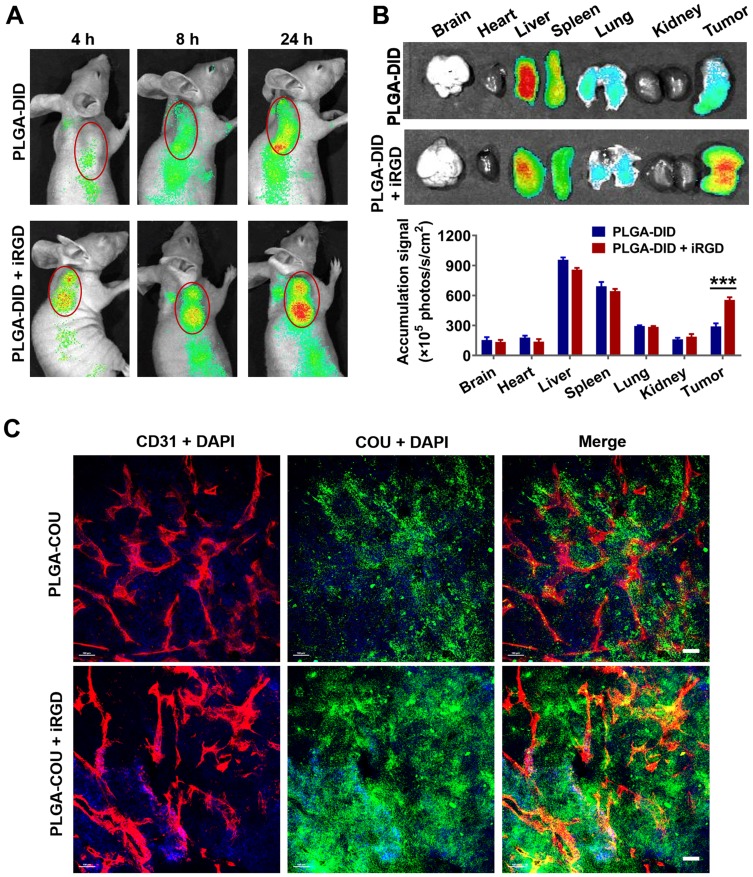
Figure 6.
Distribution of nanoparticles in tumor-bearing mice and tumor xenografts.
Notes: Mice bearing LS174T tumors (150–200 mm3) were given a single intravenous injection of PLGA-DID alone or combined with iRGD. (A) Mice were imaged using the SPECTRAL Lago NIR imaging system over time. The tumor location was marked with red circles. (B) At 24 h post injection, mice were sacrificed, and tumors and major organs were harvested for ex vivo imaging. Fluorescence intensity in tumors and organs was quantified. n=3. (C) LS174T tumors were sectioned after the injection of mice with PLGA-COU alone or in combination with iRGD. The distribution of PLGA-COU (green) within tumors was imaged under a confocal microscope. Tumor vessels were labeled with anti-CD31 antibody (red), and nuclei were visualized with DAPI (blue). Scale bar, 100 µm. ***P<0.001.
Abbreviations: PLGA, poly lactic-co-glycolic acid; DID, 1,1ʹ-dioctadecyl-3,3,3ʹ,3ʹ- tetramethylindodicarbocyanine; COU, coumarin-6; CD31, cluster of differentiation 31; DAPI, 4,6-diamidino-2-phenylindole.

