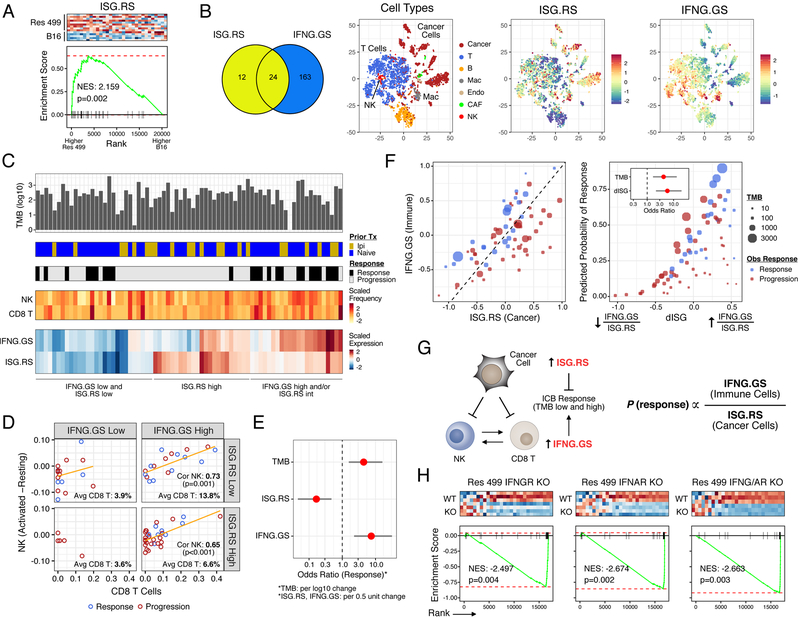
Figure 1. Distinct ISGs are differentially expressed in cancer and immune cells and have opposing functions in predicting clinical ICB response.
A) Gene set enrichment analysis (GSEA) of resistance-associated ISGs (ISG.RS) in Res 499 cells compared to parental B16 cells, both sorted from in vivo tumors. Heatmap (red is high expression, blue is low) and enrichment plot is shown along with the normalized enrichment score (NES) and p-value. B) Venn diagram of genes in the ISG.RS along with hallmark IFNG-related genes (IFNG.GS) partitioned into non-overlapping gene sets (color-coded) and used to create individual metagenes. Cell types from scRNA-seq data of pooled human melanoma tumors are shown in the tSNE plot along with expression of the ISG metagenes. C) Genomic and clinical features associated with anti-PD1 response in melanoma patients. Shown are tumor mutational burden (TMB), prior treatment with ipilimumab (Ipi), relative frequency of CD8 T cells and activated NK cells (activated minus resting) inferred by CIBERSORT, and bulk tumor expression of the ISG metagenes. D) Proportion of activated NK cells vs. CD8 T cells stratified by low/high IFNG.GS and ISG.RS expression. Regression line (orange), Pearson correlation and p-value, and percent CD8 T cells in each quadrant are shown. E) Odds ratio and 95% confidence intervals from a multivariable model for clinical anti-PD1 response. F) Expression of each metagene (left plot), and the predicted probability of anti-PD1 response (right plot) from a model using TMB and the ratio of IFNG.GS over ISG.RS (dISG). Odds ratios are shown in the inset. Circle color indicates response and size indicates TMB. G) Summary of cancer and immune cell relationships inferred by statistical modeling and how ISGs impact probability of ICB response. H) GSEA for ISG.RS genes after KO of the indicated IFN receptor in Res 499 tumors. See also Figure S1.

