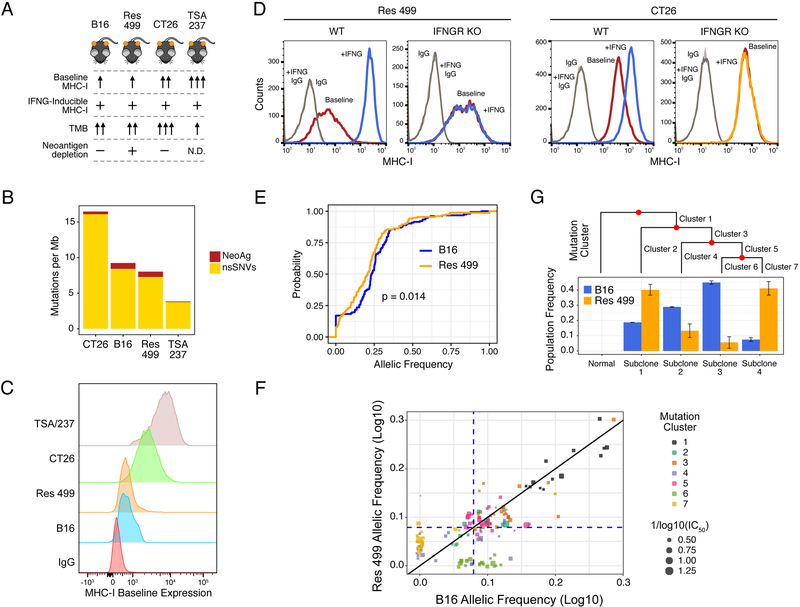
Figure 2. Mouse models differing in MHC-I, tumor mutational burden, and predicted neoantigen status.
A) Summary of key properties of mouse tumor models. N.D. is not determined. B) TMB for each of the indicated cell lines. The proportion of predicted neoantigens (MHC-I affinity ≤ 500 nM) is shown. C) Constitutive (baseline) and D) IFNG-inducible (+IFNG) MHC-I on indicated tumor cells with or without IFNGR KO. E) Cumulative distribution function plot of the allelic frequencies for predicted high-affinity (≤ 100 nM) neoantigens. The p-value is determined by an empirical distribution of the KS statistic from random variants. F) Allelic frequency of predicted high-affinity neoantigens in B16 and Res 499 tumors. Values are transformed onto a log10 scale with a near-heterozygous value for a tetraploid genome indicated (dashed blue line). Circle size corresponds to neoantigen affinity. Circle color corresponds to neoantigen clusters predicted to be evolutionarily related and giving rise to G) subclonal populations (Subclone 1–4) inferred from high quality variants and displayed using a phylogenetic tree. Frequencies of these subclonal populations are shown. See also Figure S2.

