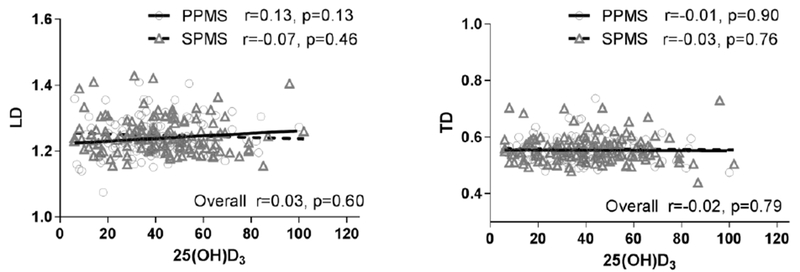
Figure 2:
Scatterplot of DTI including LD and TD versus 25(OH)D3 level with estimated regression lines for both PPMS and SPMS.
Pearson correlation (r, p value) and the correlation within each MS type are presented. PPMS, primary progressive multiple sclerosis; SPMS, secondary progressive multiple sclerosis; DTI, diffusion tensor imaging; LD, longitudinal diffusivity; TD, transverse diffusivity

