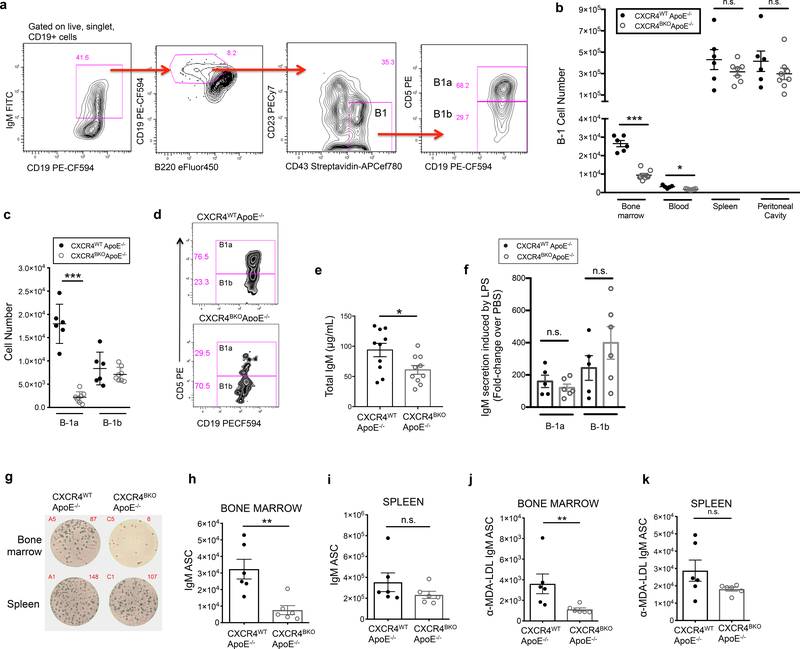
Figure 3. CXCR4 is critical for maintaining bone marrow B-1a cell number, bone marrow IgM ASC, and circulating IgM levels in ApoE−/− mice.
(a) Representative gating strategy for quantification of bone marrow B-1 cells by flow cytometry. (b) Quantification of B-1 cells from the bone marrow, blood, spleen, and peritoneal cavity of 8-week-old CXCR4WT ApoE−/− (n=6) or CXCR4BKO ApoE−/− (n=8) mice using flow cytometry. (c) Quantification of B-1a and B-1b cell number in bone marrow of CXCR4WT ApoE−/− (n=6) and CXCR4BKO ApoE−/− (n=8) mice. (d) Representative flow plots of B-1a and B-1b gating from bone marrow of CXCR4WT ApoE−/− or CXCR4BKO ApoE−/− mice. (e) Calculated concentration of total IgM in sera of 8-week-old CXCR4WT ApoE−/− (n=10) or CXCR4BKO ApoE−/− (n=10) mice. (f) Fold change in concentration of IgM in supernatants of cultured peritoneal B-1a or B-1b cells from CXCR4WT ApoE−/− (n=5) or CXCR4BKO ApoE−/− (n=6) mice in response to 50 μg/mL LPS over the amount secreted in response to control PBS. (g) Representative ELISPOT wells depicting IgM antibody-secreting cells (ASC) from bone marrow and spleen of 8-week-old CXCR4WT ApoE−/− or CXCR4BKO ApoE−/− mice. Calculated numbers of IgM ASC in bone marrow (h) and spleen (i) of 8-week-old CXCR4WT ApoE−/− (n=6) or CXCR4BKO ApoE−/− (n=6) mice. Calculated numbers of anti-MDA-LDL IgM ASC in bone marrow (j) and spleen (k) of 8-week-old CXCR4WT ApoE−/− (n=6) or CXCR4BKO ApoE−/− (n=6) mice. Error bars represent mean ± s.e.m. *P<0.05, **P<0.01, ***P<0.001, or n.s. indicating non-significant p-value by Mann-Whitney test.

