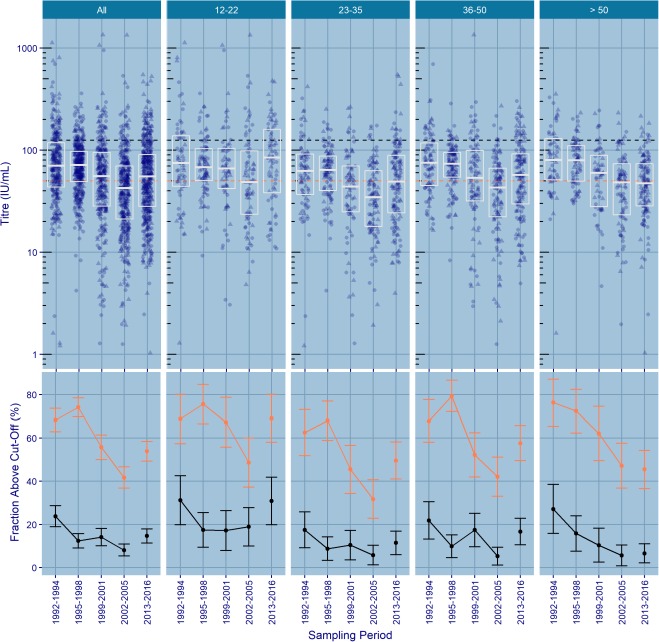
Figure 1.
Top panel: pertussis IgG titres by sampling period and age group. Individual titres are plotted per sampling period (circles indicate female and triangles indicate male). Boxes indicate median and quartile ranges; orange and black dashed lines indicate antibody levels at 50 and at 125 IU/mL, respectively. Bottom panel: percentages of subjects with IgG titres of >50 IU/mL (orange) and >125 IU/mL (black) by sampling period and age group.

