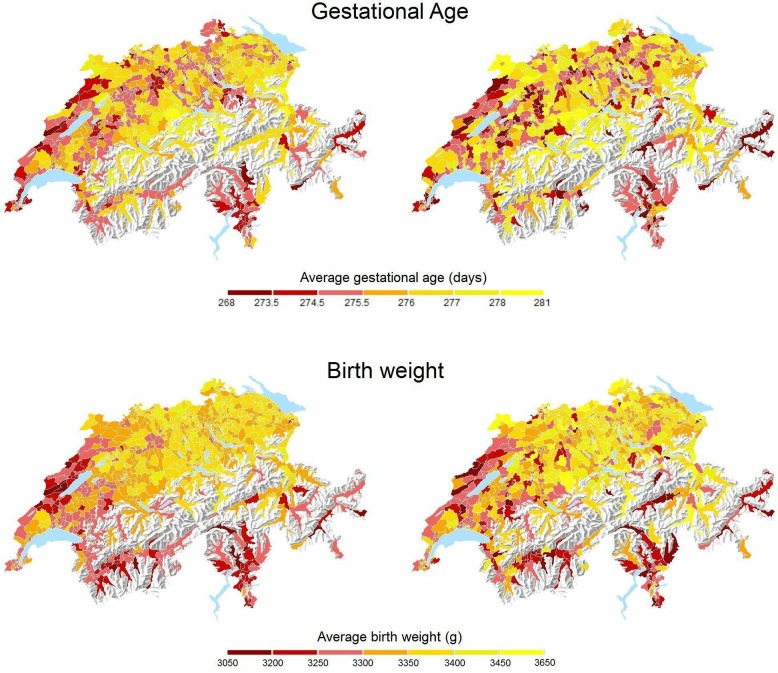
Figure 1.
Maps of average gestational age (upper two panels) and birth weight (lower two panels) observed across 705 Swiss areas. Left: all eligible live births (n=3 15 177), right: complete case population (n=81 968). Note that 277 days correspond to 394/7 weeks. The orientation of the maps is standard, with North being up.

