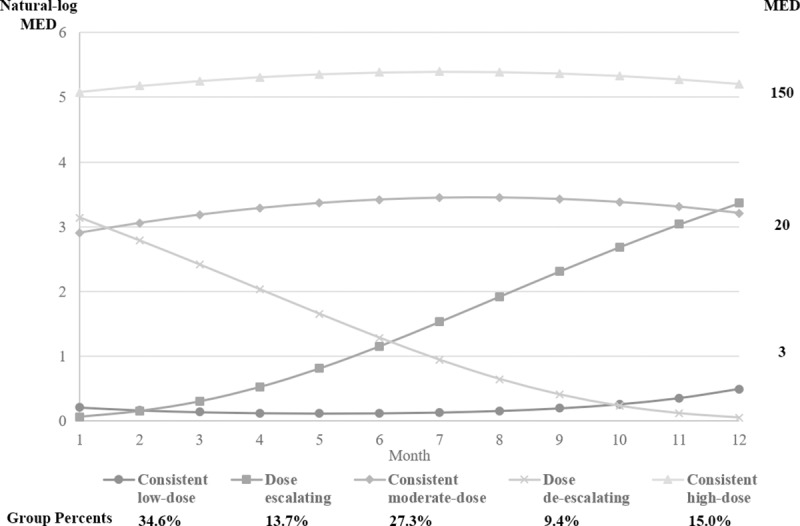
Fig 3. Trajectories of mean daily MED in milligrams prescribed in each month for the 12 months preceding diagnosis of OUD or overdose OD in adults who filled at least 1 opioid prescription.

In each subfigure, lines represent types of dose trajectory group, and for each line, each point represents mean daily MED of prescription opioids per month. The scale on the left and right side of the figure was natural logarithm of MED and actual MED, respectively. MED, morphine equivalent dose; OD, overdose; OUD, opioid use disorder.
