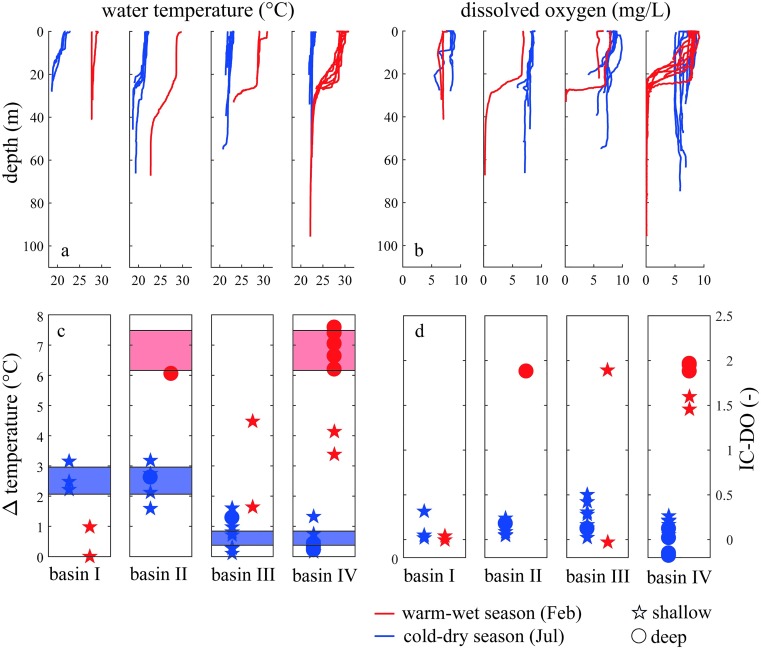
Fig 3.
Thermal and chemical stratification in the four sub-basins of Lake Kariba for February (red) and July (blue). Observed vertical profiles of water temperature (a) and dissolved oxygen (b) in the four sub-basins of Lake Kariba. The strength of the stratification is shown as the temperature difference between the top and bottom 5 m in each profile (c). Strength of the oxygen stratification (d). Circles in panels c and d represent deep parts of the lake and stars represent shallow parts. The threshold between shallow and deep is 50 meters. Blue areas represent the 95% confidence intervals of the mean stratification strength during the cold-dry season in the first two and second two sub-basins, respectively. The red area represents the confidence intervals of the mean stratification strength during the warm-wet season for deep locations.

