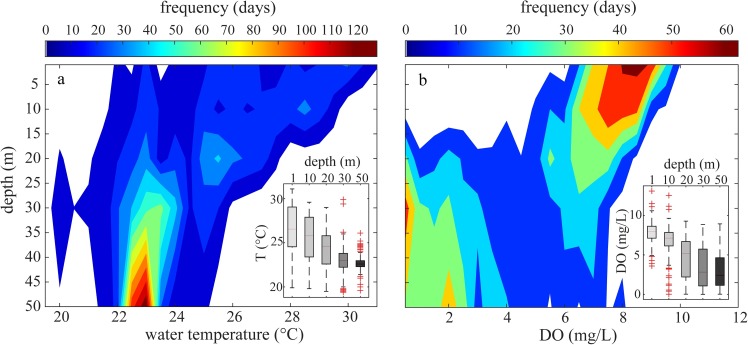
Fig 7. Frequency maps of lake water temperature and dissolved oxygen.
Empirical frequency maps of (a) water temperature-depth and (b) oxygen as a function of water depth for Lake Kariba calculated by using the aggregated database of this study [34]. Frequency is quantified as the average number of days per year (colour-coded) in which observed temperatures and oxygen concentrations fall within a bin of 0.5°C for temperature and 0.5 mg L-1 for oxygen. The box plots show the statistical distributions (medians, 25th and 75th percentiles) of water temperature and dissolved oxygen at five different depths. The whiskers extend to the most extreme data points not considered outliers, and the outliers are plotted individually using the '+' symbol.

