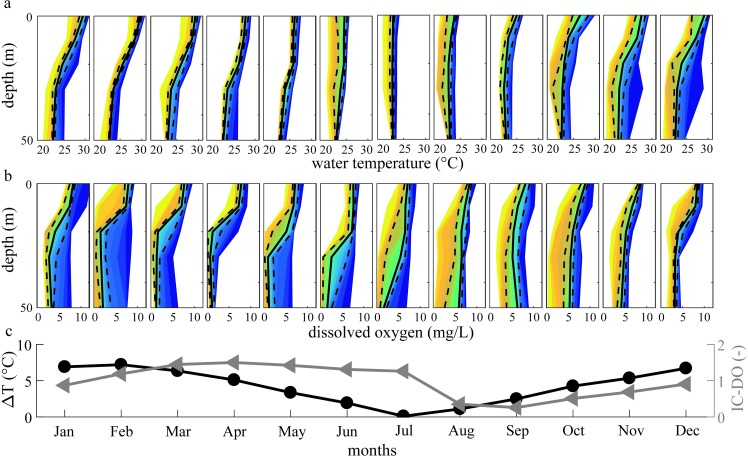
Fig 8.
Monthly (a) lake water temperature and (b) dissolved oxygen variability. Solid black lines represent medians, dashed lines represent 25th and 75th percentiles, and the different colours represent the percentiles from 5th to 95th with a step of 5%. (c) Monthly stratification coefficients for water temperature (black dots) and dissolved oxygen (grey triangles) for each month of the year, using the temperature difference (°C) between the upper- and the lowermost 5 m layer of the median thermal profiles and the IC-DO of each month.

