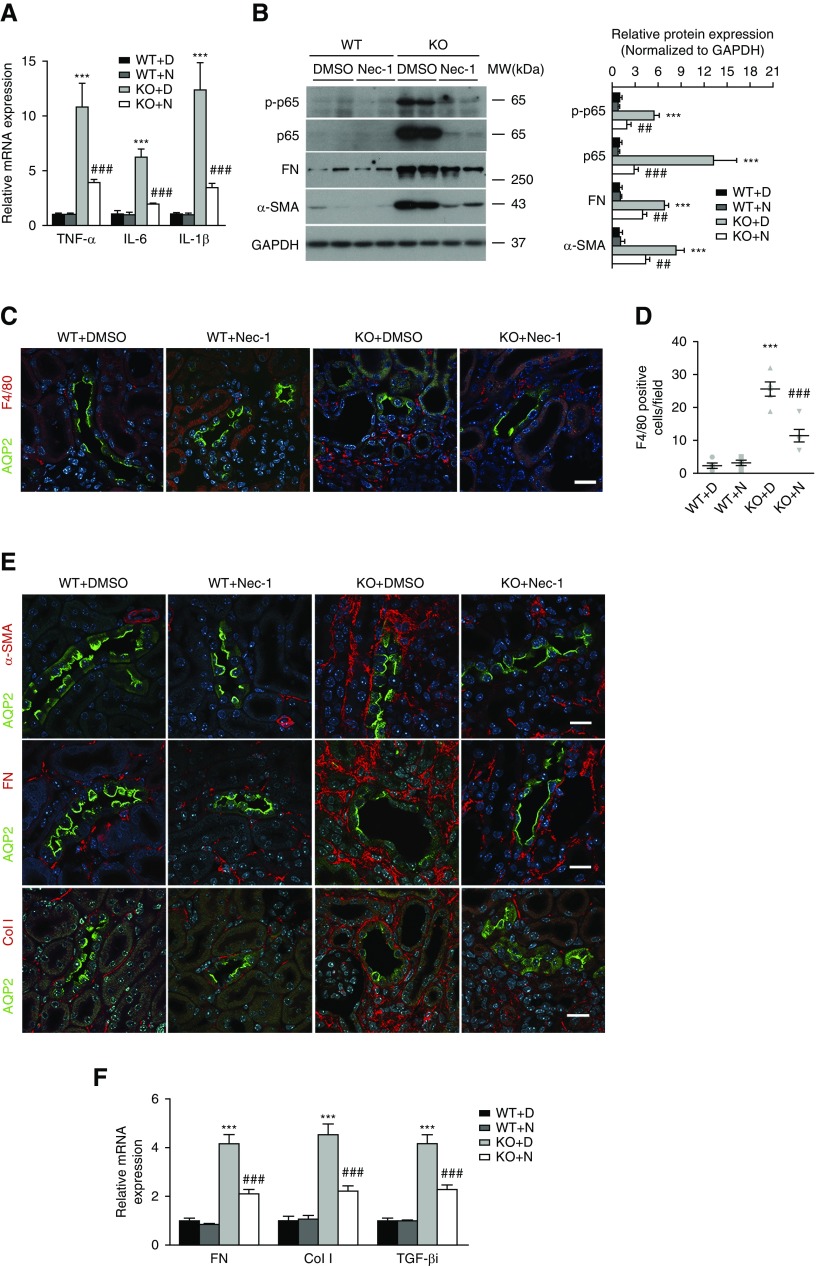
Figure 8.
Nec-1 blocks inflammatory response and fibrosis in PC Ilk KO kidney. (A) Nec-1 suppressed gene expression of TNF-α, IL-6, and IL-1β in Ilk KO kidney as revealed by real-time PCR. Expression of individual genes was normalized to β-actin. ***P<0.001 versus wild-type (WT) with DMSO mice; ###P<0.001 versus KO with DMSO mice. (B) Representative immunoblotting showed that Nec-1 inhibited the upregulation of phosphorylated NF-κB p65 (p-p65), total p65, fibronectin (FN), and α-SMA in Ilk KO kidney (left). Protein expression of p-p65, total p65, FN, and α-SMA was quantified by densitometry and normalized to glyceraldehyde-3-phosphate dehydrogenase (GAPDH) (right). ***P<0.001 versus wild-type with DMSO mice; ##P<0.01, ###P<0.001 versus KO with DMSO mice. (C) Representative immunofluorescence staining showed reduced infiltration of F4/80-positive macrophages (red) in Nec-1–treated KO kidney. CD PCs were indicated by staining of AQP2 (green). Scale bar, 20 μm. (D) The number of F4/80-positive cells was quantified per field (mean±SEM/field). ***P<0.001 versus wild-type with DMSO mice; ###P<0.001 versus KO with DMSO mice. Original magnification, 400×. (E) Representative immunofluorescence images revealed decreased expression of α-SMA (red), FN (red), and collagen type 1 (Col I, red) in Nec-1–treated Ilk KO kidney. Green fluorescence signal indicates the AQP2-positive CDs. Nuclei were stained blue with DAPI. Scale bar, 20 μm. (F) Nec-1 decreased gene expression of FN, Col I, and TGF-βi in Ilk KO kidney by real-time PCR. Expression of individual genes was normalized to β-actin. ***P<0.001 versus wild-type with DMSO mice; ###P<0.001 versus KO with DMSO mice. Data presented as mean±SEM, n=5–7. Statistics were performed using one-way ANOVA. KO+D, KO mice treated with 1% DMSO in PBS; KO+N, KO mice treated with Nec-1; WT+D, wild-type mice treated with 1% DMSO in PBS; WT+N, wild-type mice treated with Nec-1.

