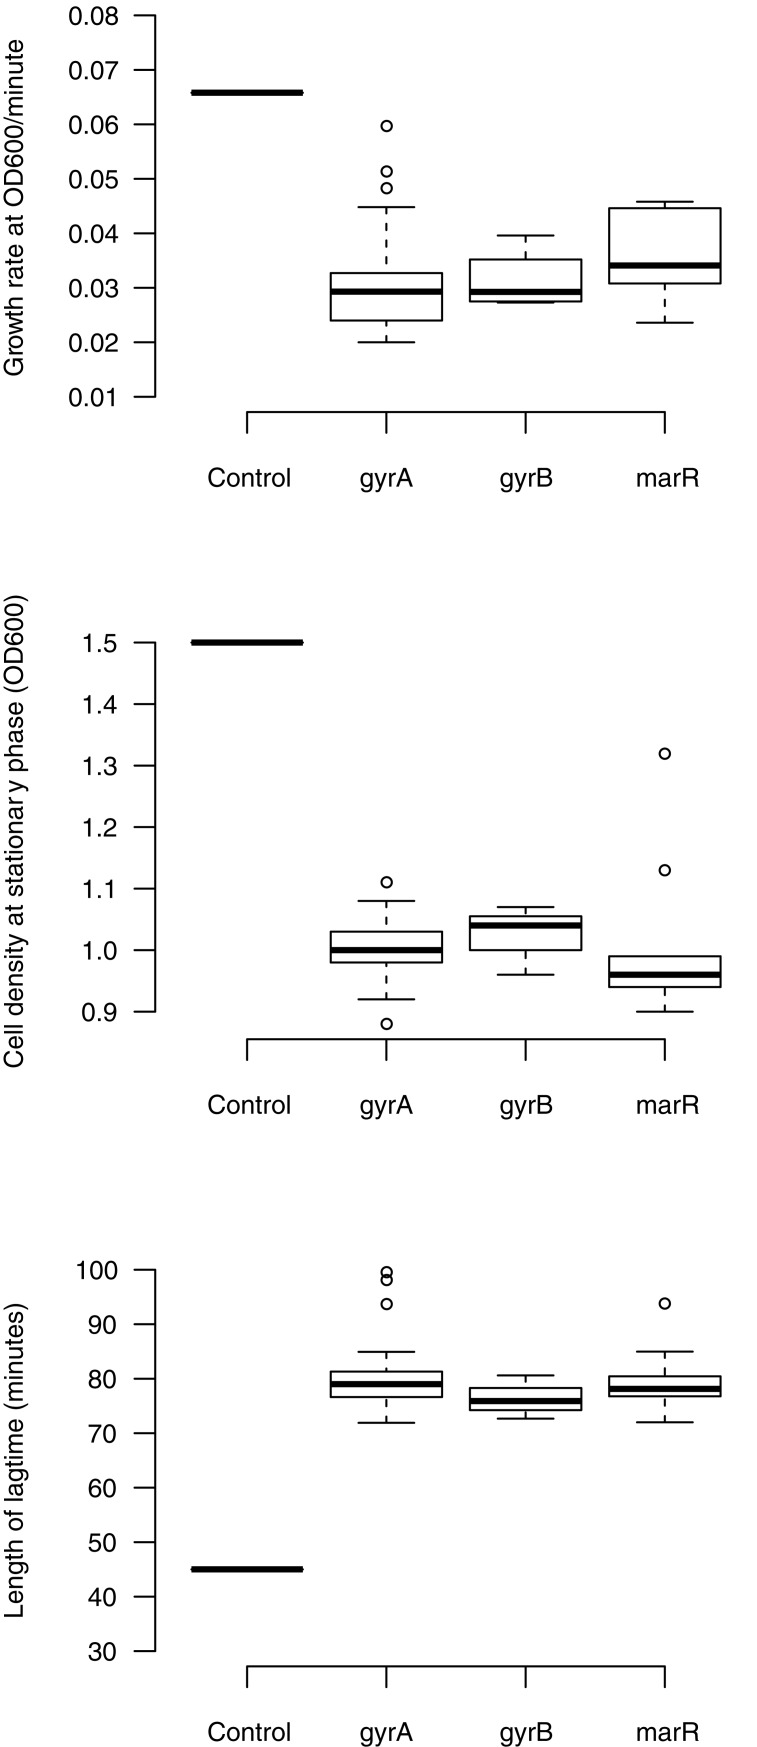
Fig 5. Costs of resistance of quinolone resistant mutants.
The fitness components measured are growth rate, cell density, and lag time between gyrA, gyrB, and marR resistance mutations. All the fitness components are compared to control E. coli K-12 (MG1655). The boxplot presents the median, first, and third quartiles, with whiskers showing either the maximum (minimum) value or 1.5 times the interquartile range of the data, whichever is smaller (larger).

